Gallery#
PaleoBooks is a compendium of digital resources to bridge the gap between paleoclimate observations and models, and between past, present and future. The goal is as much to encourage adoption of open-source, free languages like R and Python by the observational paleoscience community as it is to encourage the modeling community to leverage the unique information coming from paleo archives.
The scholarly objects shown below are of several types:
Tutorials on how to overcome a particular technical difficulty (“Life Hacks”)
Tutorials on how to leverage open-source code to achieve easier, more transparent, or more powerful scientific workflows (“Science Bits”)
Examples of novel paleoscience using the Python ecosystem e.g. as turn-key supplementary material from recent publications (“Papers”)
In the following, “PaleoBooks” refers to curated collections of Jupyter Notebooks organized around various themes. “Chapters” refers to the components of these PaleoBooks. A system of tags allows both PaleoBooks and individual chapters to be associated with one another based on individual themes or methodologies, in addition to their host PaleoBook. These tags enable searching along 3 directions:
“Domains” refers to scientific themes or methodologies
“Formats” refers to the type of resource (Life Hacks, Science Bits, or Papers)
“Packages” refers to the packages being used in each notebook (e.g. Xarray)
The gallery below is a work in progress, and we encourage you to contribute your own analyses if you think they might bring enlightenment to, and/or ease the life of, fellow scientists.
PaleoBooks#
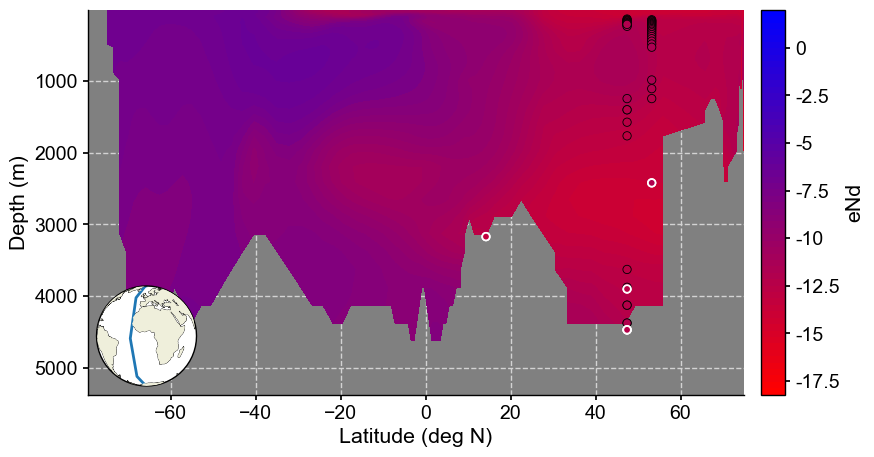
Paleoceanography watermass geometry tracers coordinate systems machine learning eNd clustering C14 Mystery Interval model output oceanography data viz Deglaciation, seaborn matplotlib pandas scikit-learn xarray cartopy intake, Lifehacks Science Bits

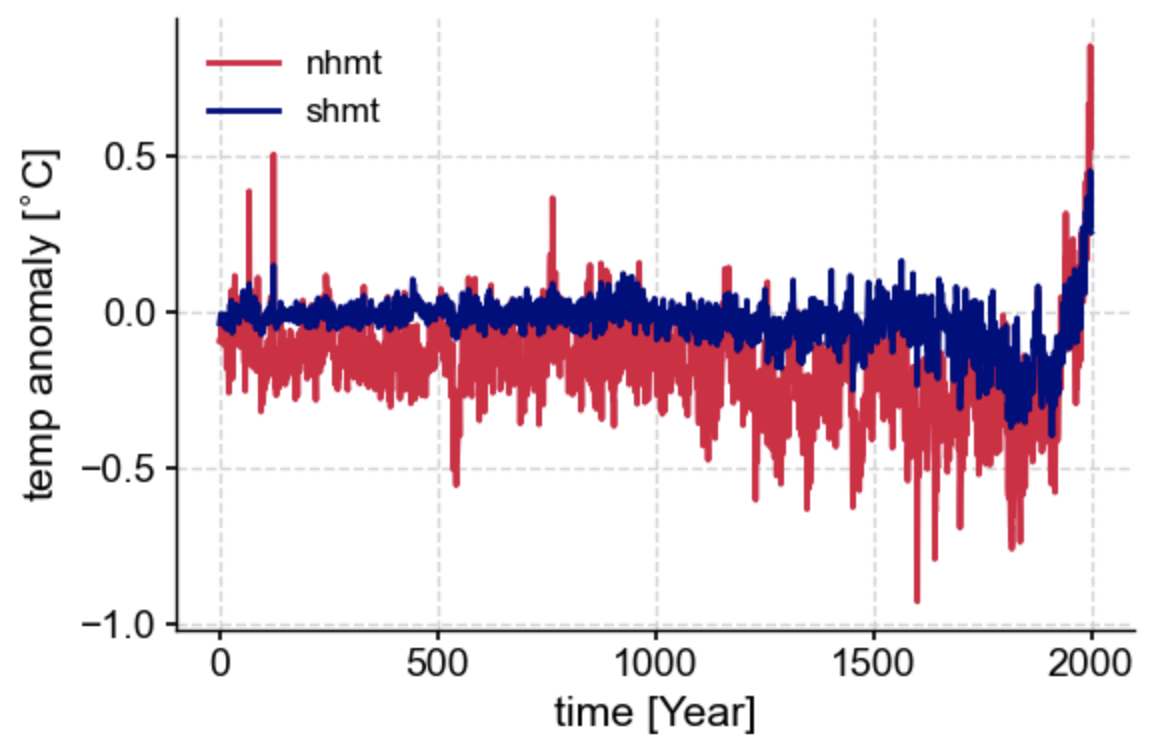
proxy composite temperature, seaborn numpy pyleoclim pandas cfr, Science Bits

endmember mixing tracers watermass geometry clustering, basemap matplotlib sqlalchemy pandas scikit-learn scipy, Science Bits
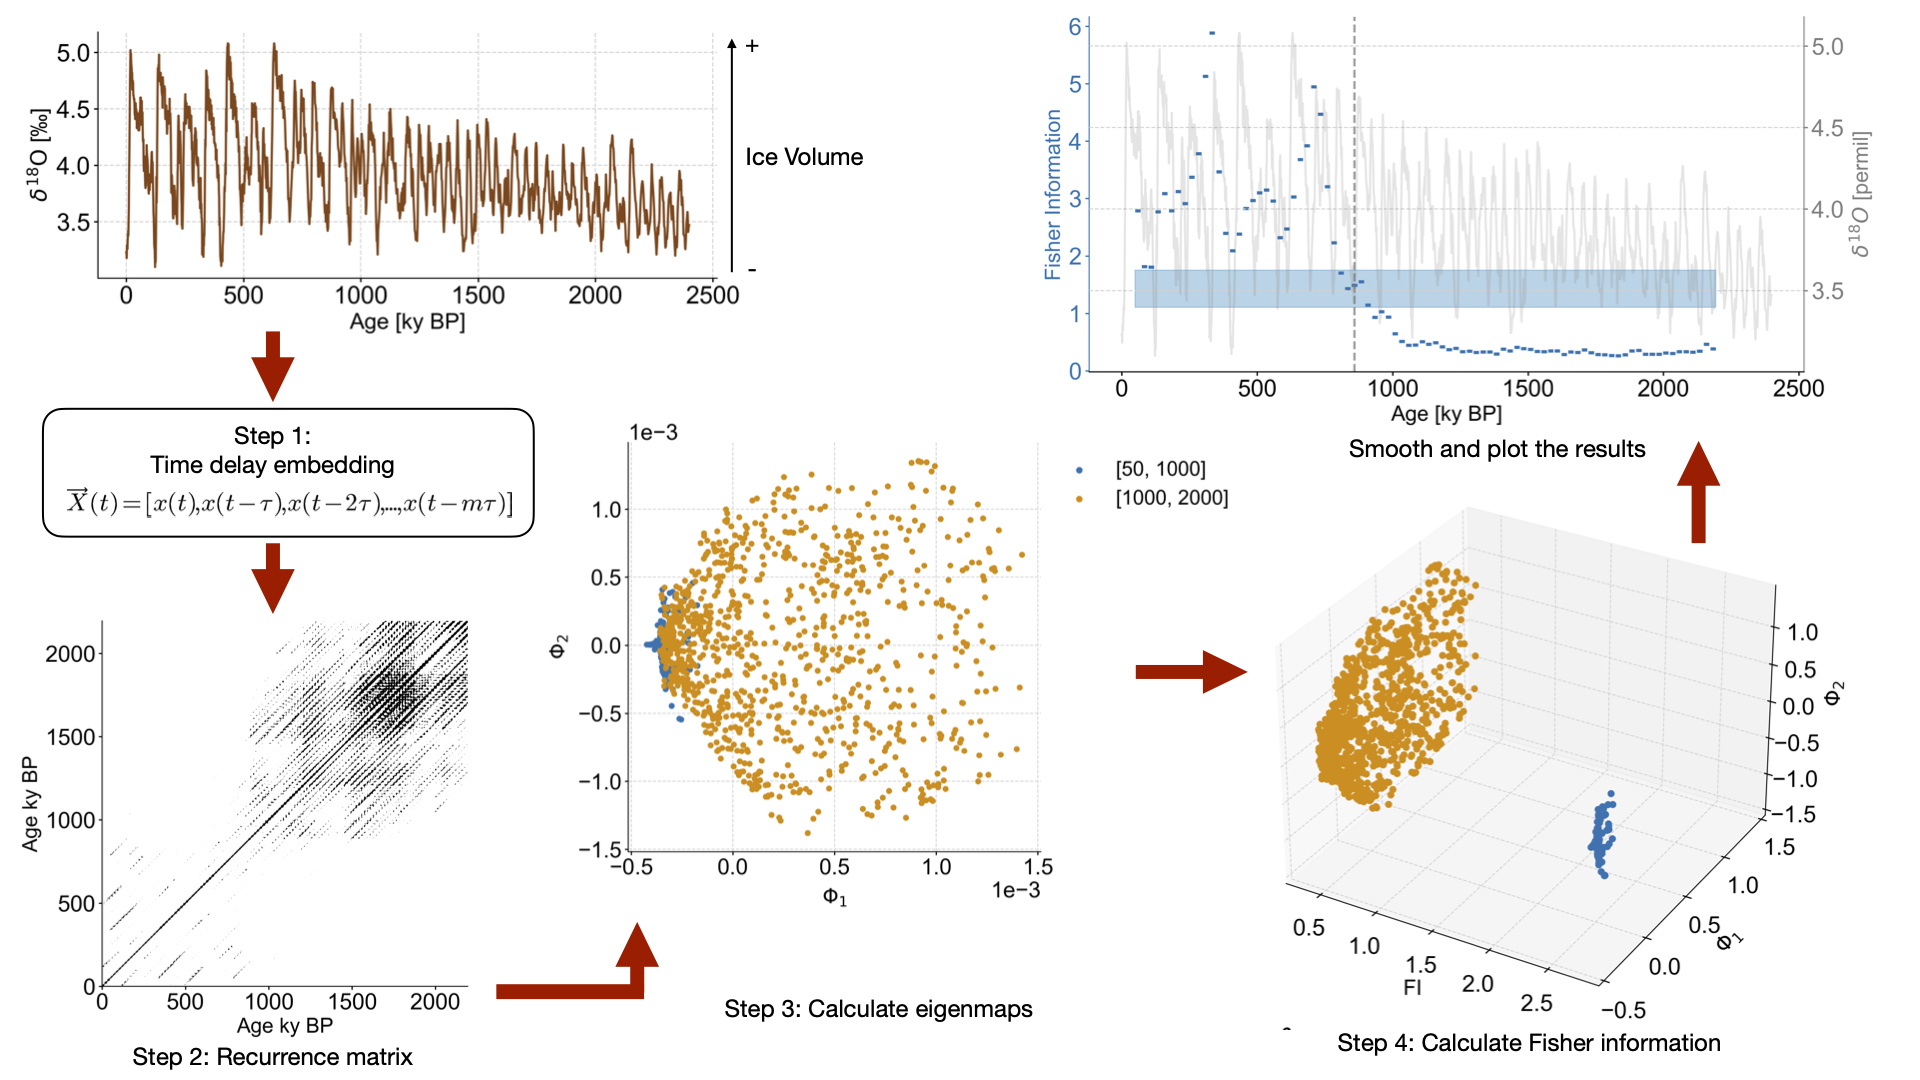
data viz, ammonyte matplotlib pyleoclim, Main Analysis Extras

age uncertainty wavelet analysis paleoclimate insolation spectral analysis paleoceanography model-data comparison correlation model output cross-wavelet analysis, pylipd pyleoclim xarray climlab cartopy, Science Bits
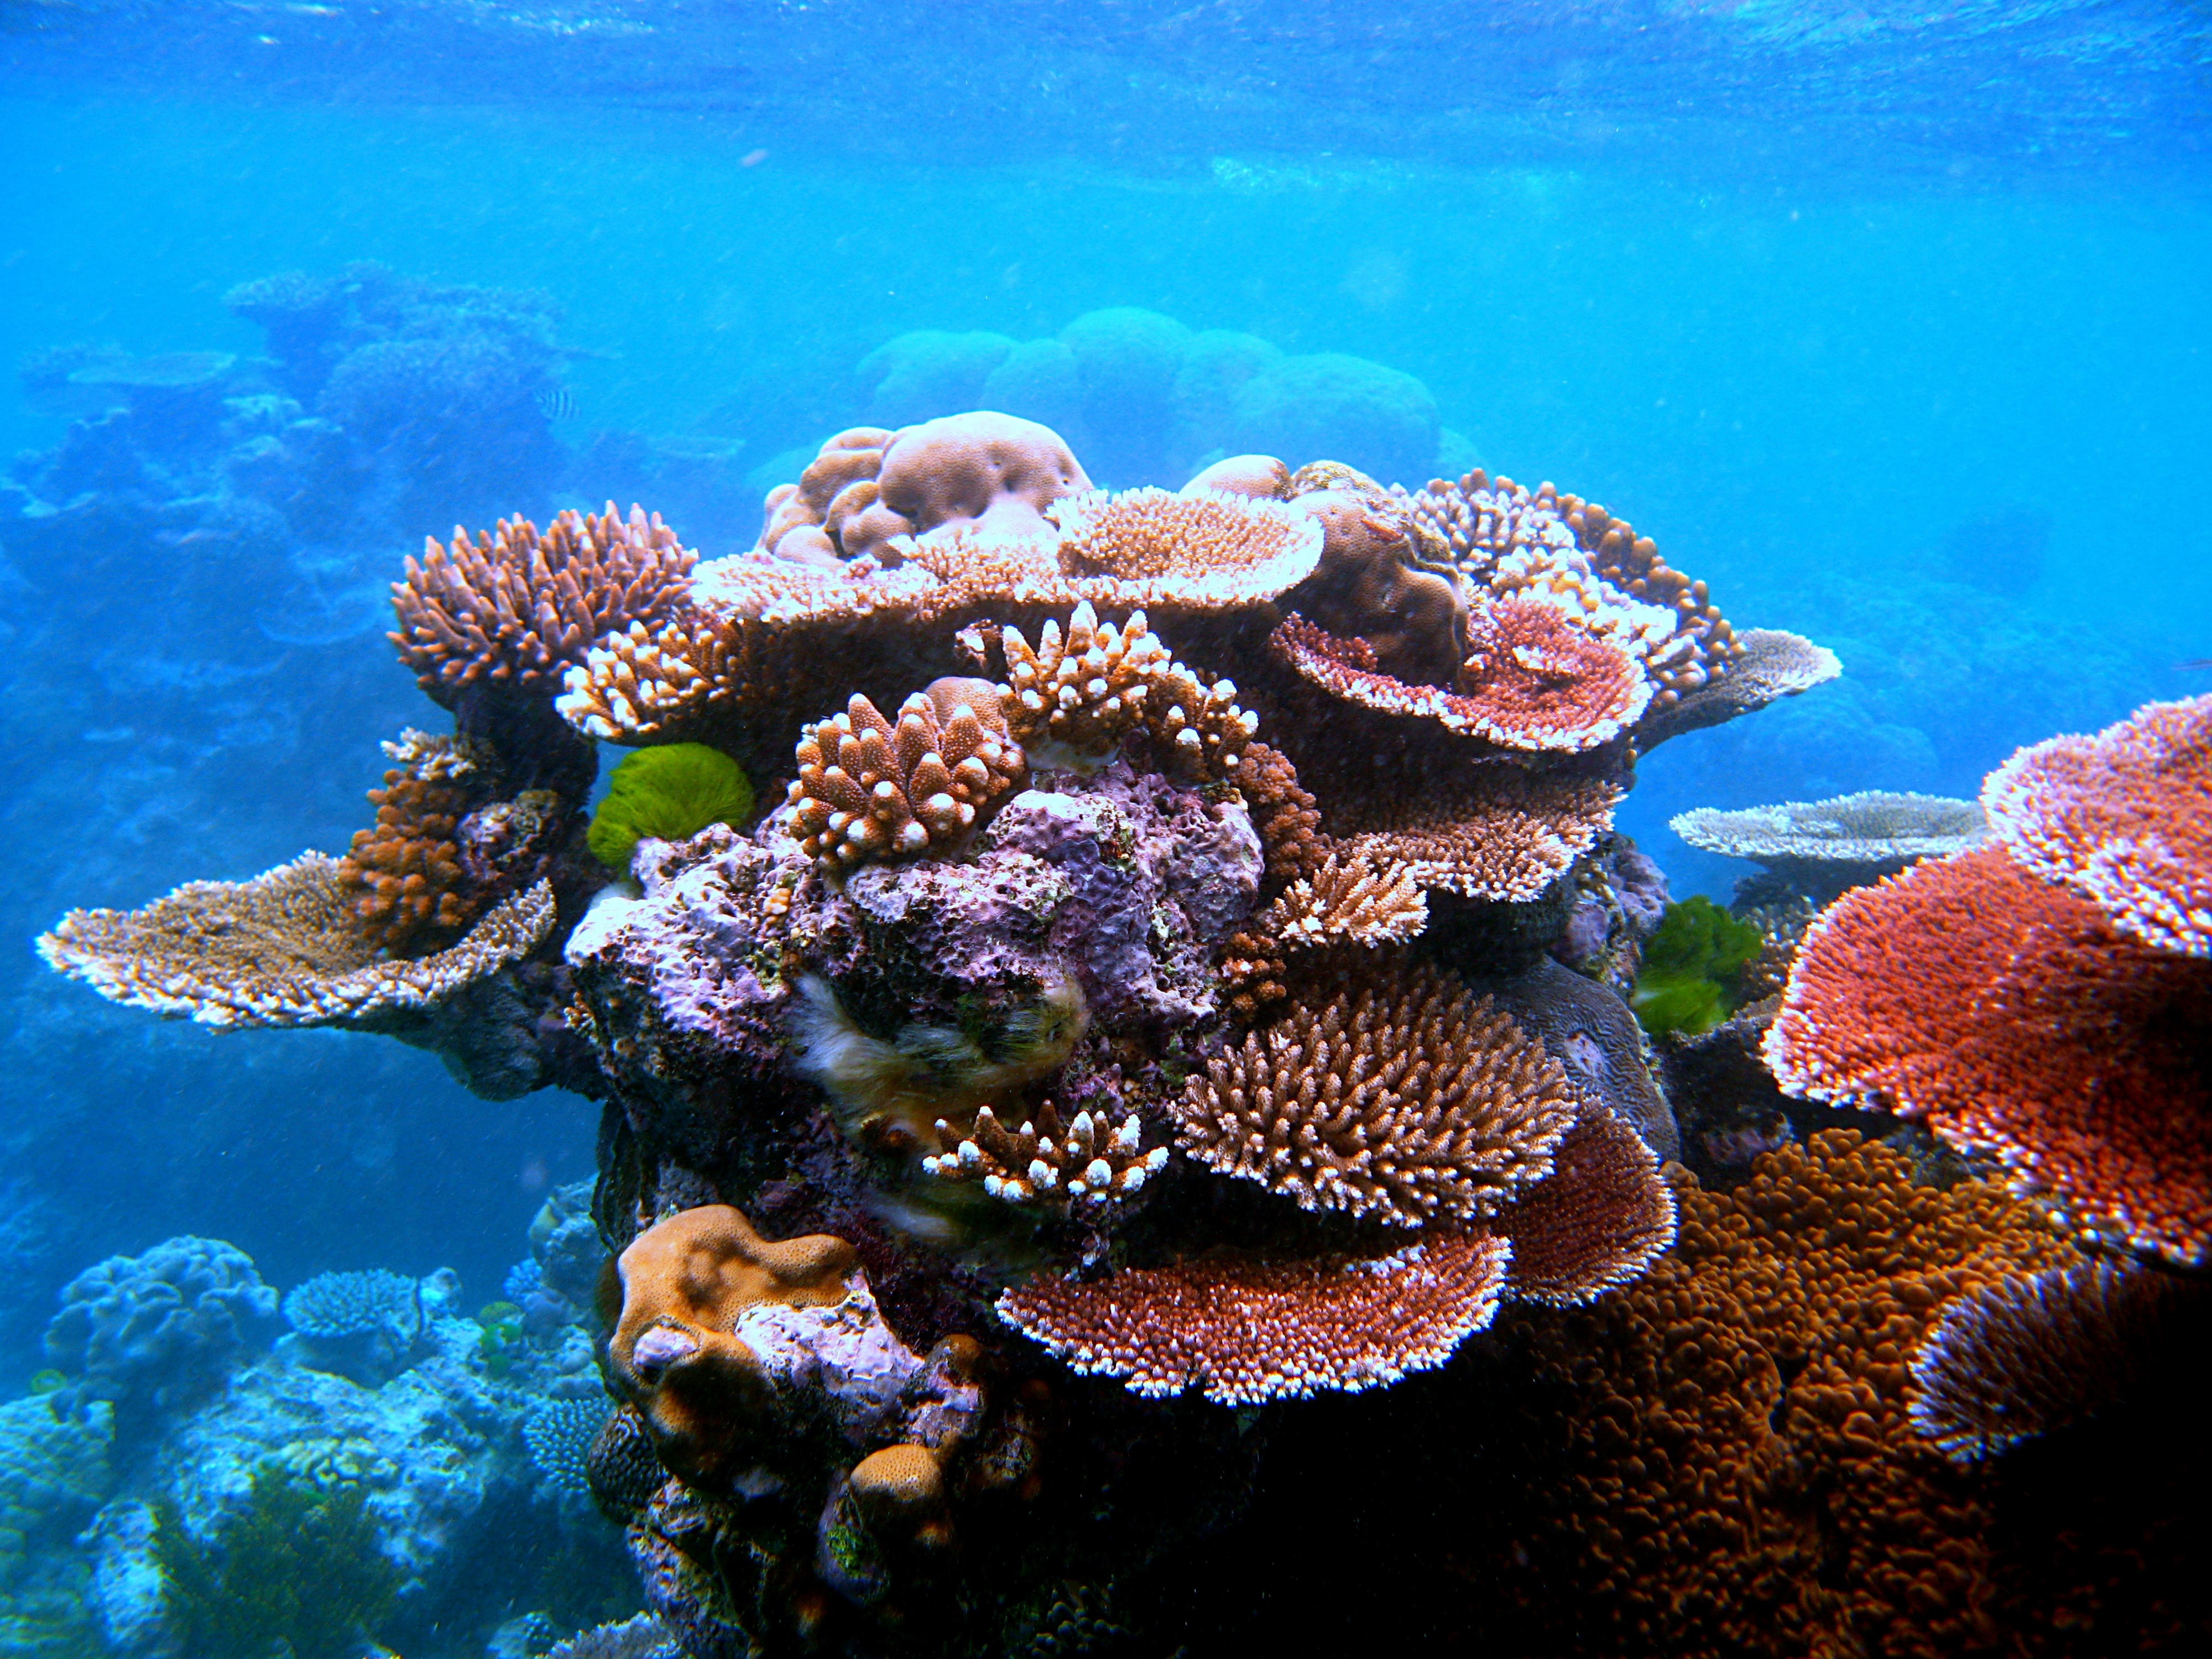
coral Statistics Bayesian Statistics paleoceanography Calibration Sr/Ca Paleocenography calibration, matplotlib pyleoclim Great Tables pymc statsmodel pandas arviz, Getting Started Calibration

PCA paleoceanography modeling, eofs matplotlib pyleoclim pandas xarray cartopy, Science Bits
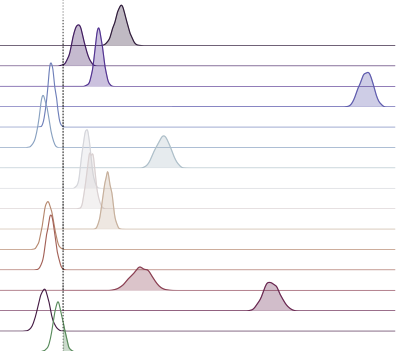
PMIP statistics reconstruction Common Era data assimilation PaMoDaCo paleoclimatology data viz timeseries modeling, seaborn matplotlib pyleoclim statsmodels pens pandas scipy, Temporal Interpretation Plume Distance Motivation Paleoclimate Applications
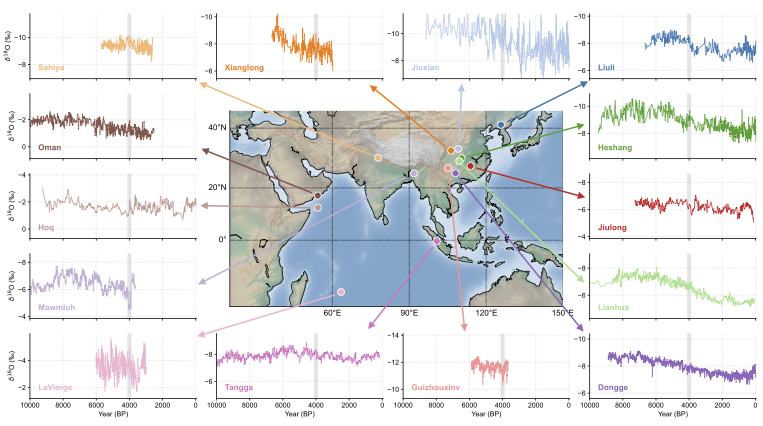
data analysis data wrangling data viz, pylipd pyLiPD matplotlib basemap pyleoclim ammonyte, Loading Data Main Analysis Exploring the Data

dimension reduction ensemble age uncertainty age modeling wavelets data wrangling uncertainty quantification regression visualization tidyverse spectral analysis mapping PCA correlation LiPD calibration, readr lipdR ggplot2 purrr oxcAAR dplyr, Extensions Core Methods Data Manipulation

geospatial signal processing statistics data wrangling paleoclimate data analysis data viz, pylipd matplotlib numpy pyleoclim climlab cartopy, Heuristic Examples Correlation Analysis Global Coherence Analysis Exploring the Data

climate sensitivity data supplement data viz, statsmodels scipy matplotlib pyleoclim, Main Analysis Supplement EC Calculations
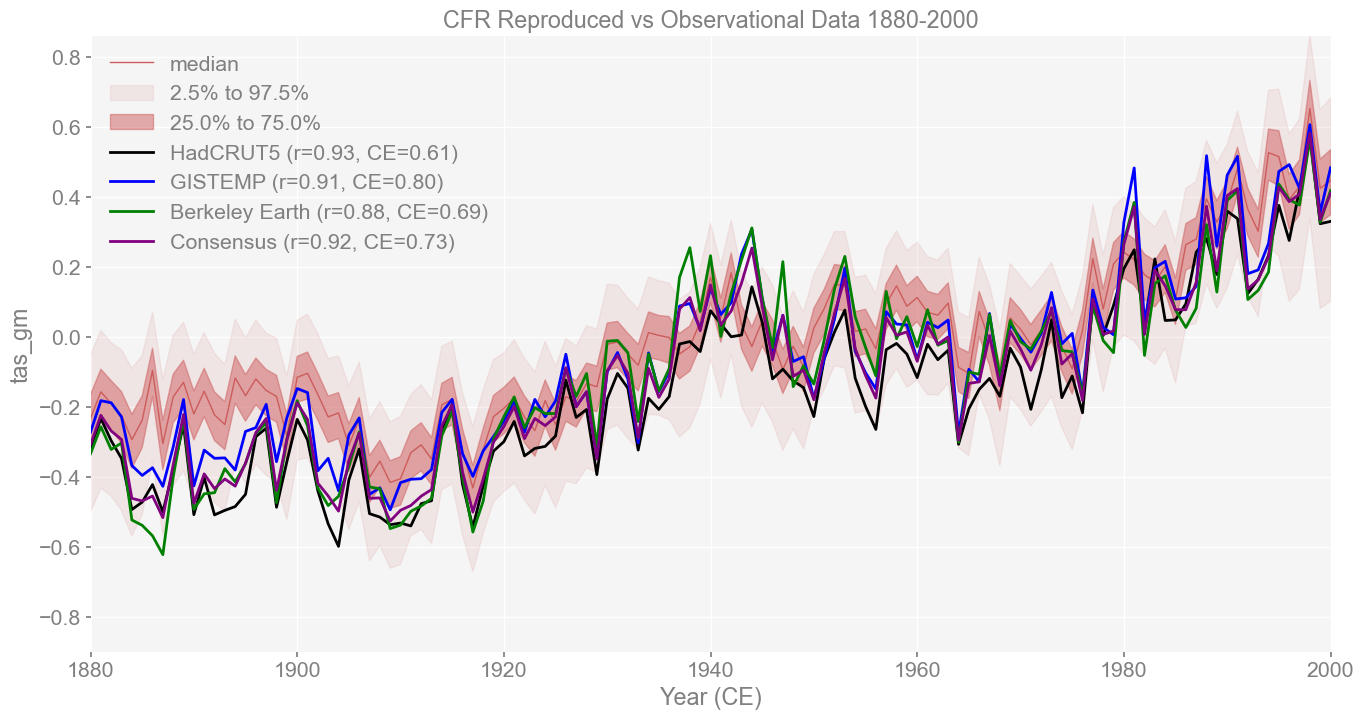
data assimilation data analysis data wrangling data viz, pens cfr xarray matplotlib, Validation and Comparison Data Assembly Data Assimilation
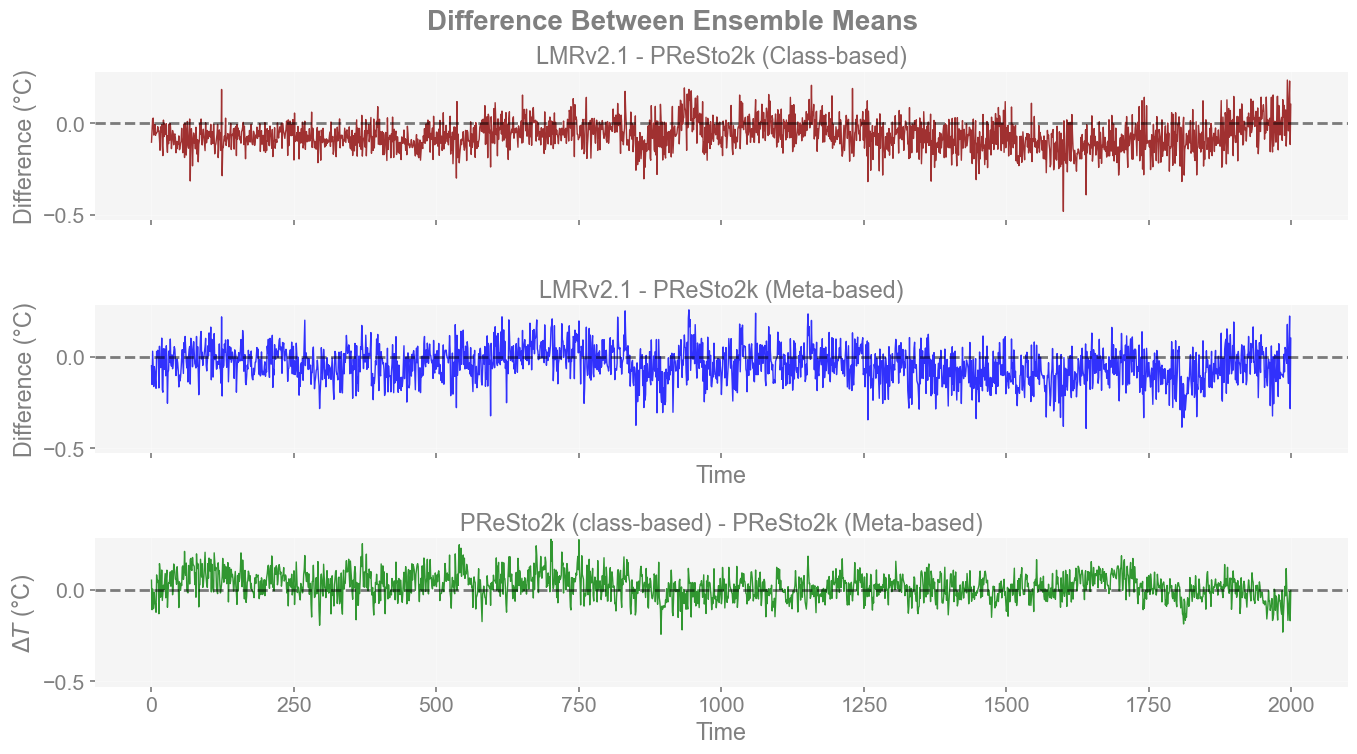
data assimilation data analysis data wrangling data viz, pylipd matplotlib pens cfr cartopy, Validation and Comparison Data Assembly Data Assimilation
Chapters#
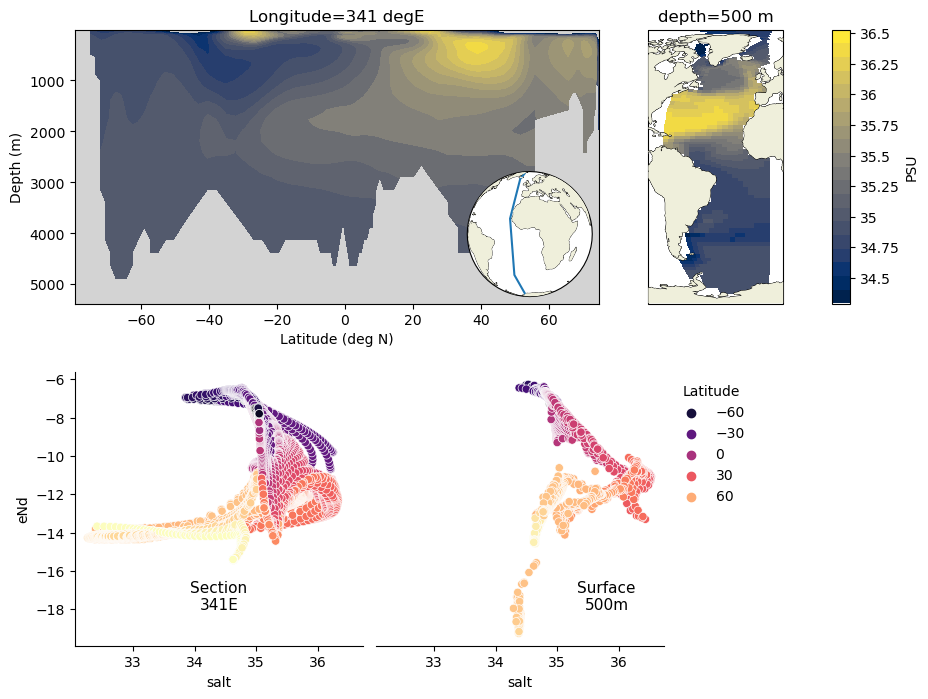
oceanography tracers data viz, xarray matplotlib cartopy pandas seaborn, Lifehacks
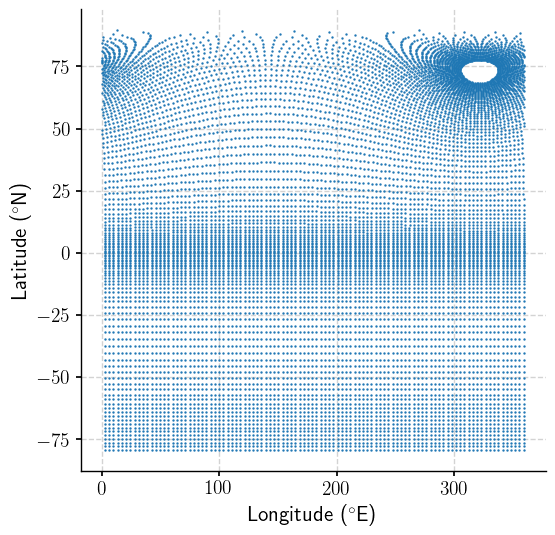
model output oceanography coordinate systems, xarray matplotlib cartopy pandas intake, Lifehacks
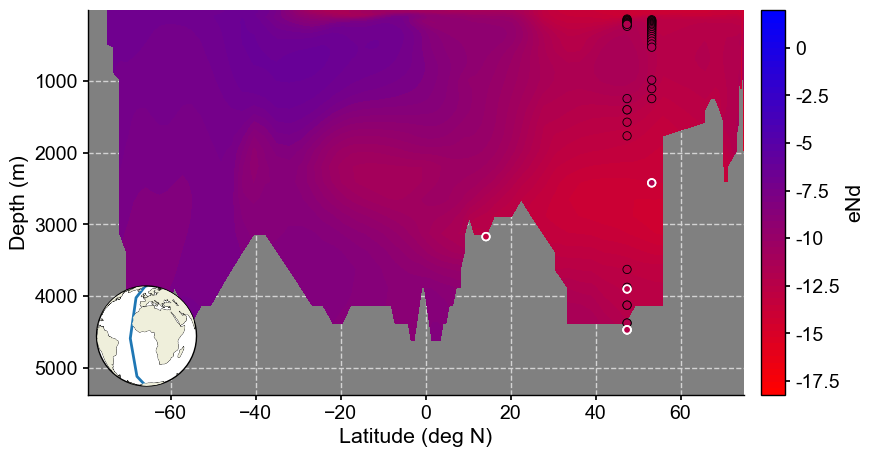
model output eNd, xarray matplotlib cartopy pandas, Science Bits
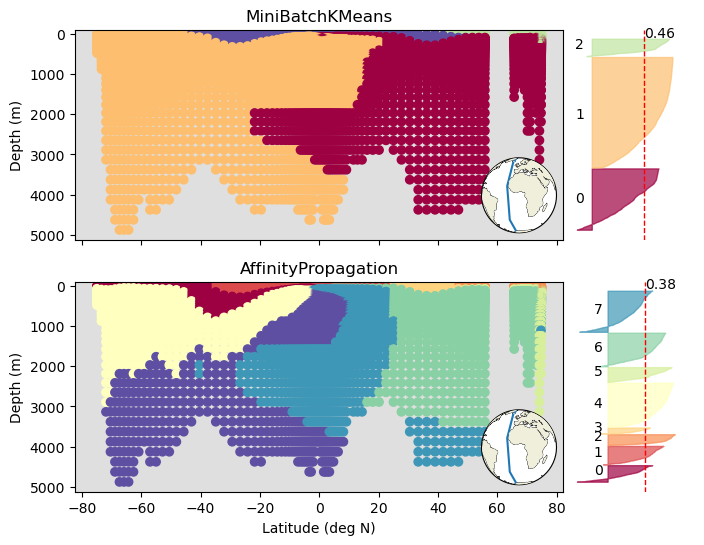
clustering machine learning watermass geometry, xarray matplotlib cartopy scikit-learn, Science Bits
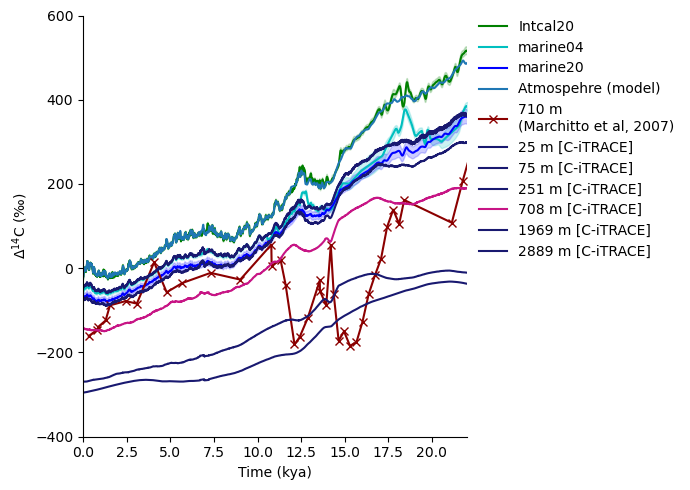
C14 Paleoceanography Deglaciation Mystery Interval, xarray matplotlib cartopy pandas, Science Bits
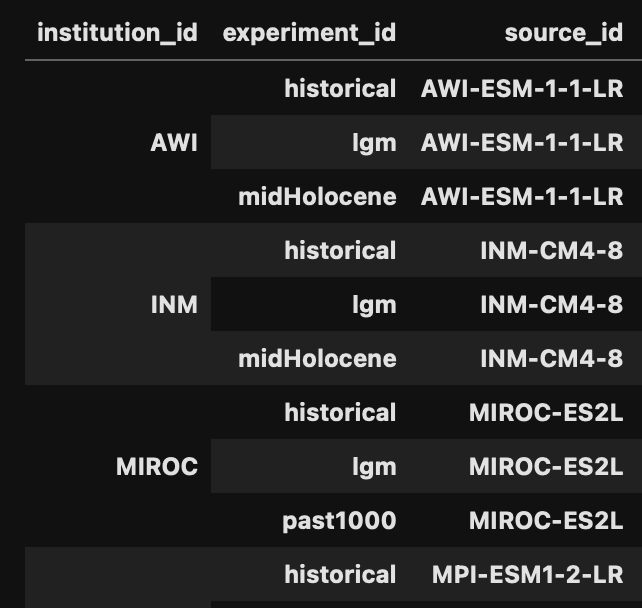
AWS cloud-ready data data viz CMIP6, intake AWS xarray pandas, Lifehacks
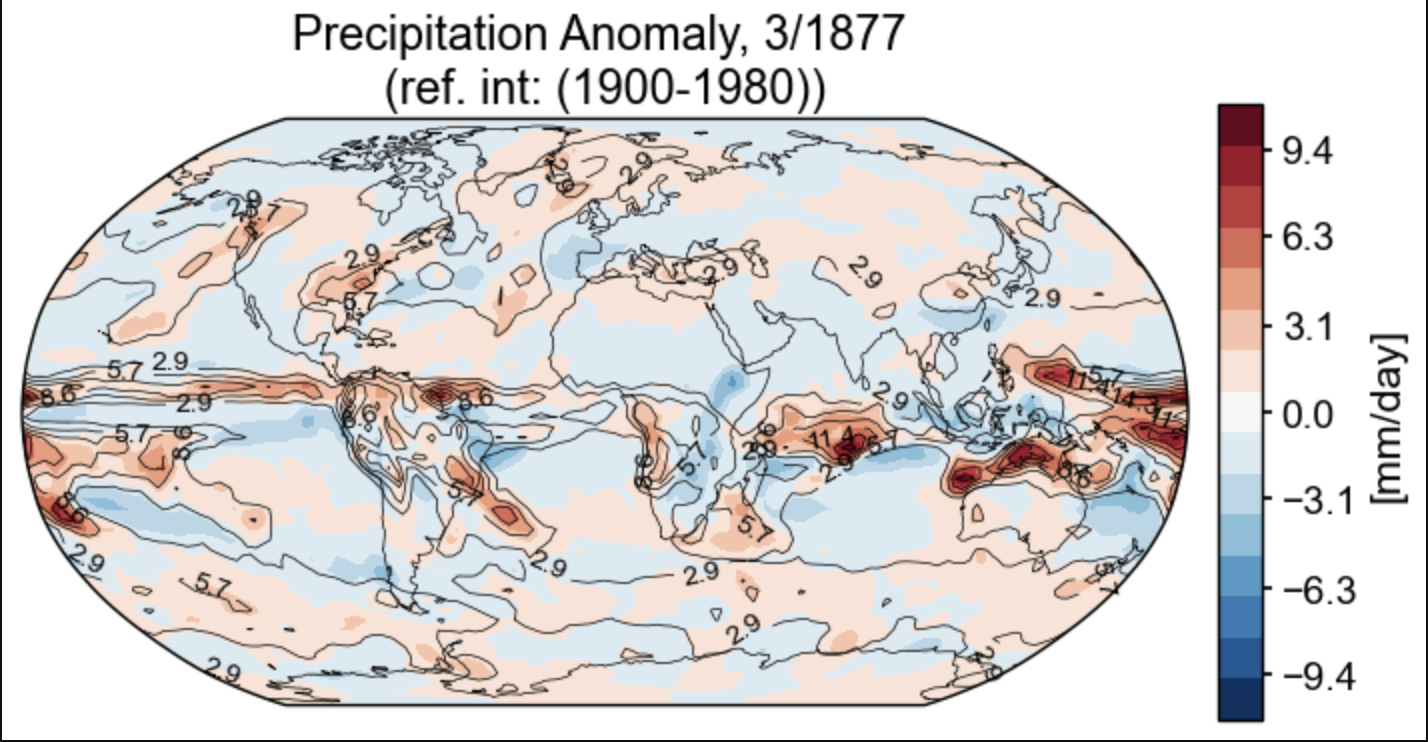
model output CMIP6 coordinate systems, xarray matplotlib cartopy pandas, Lifehacks
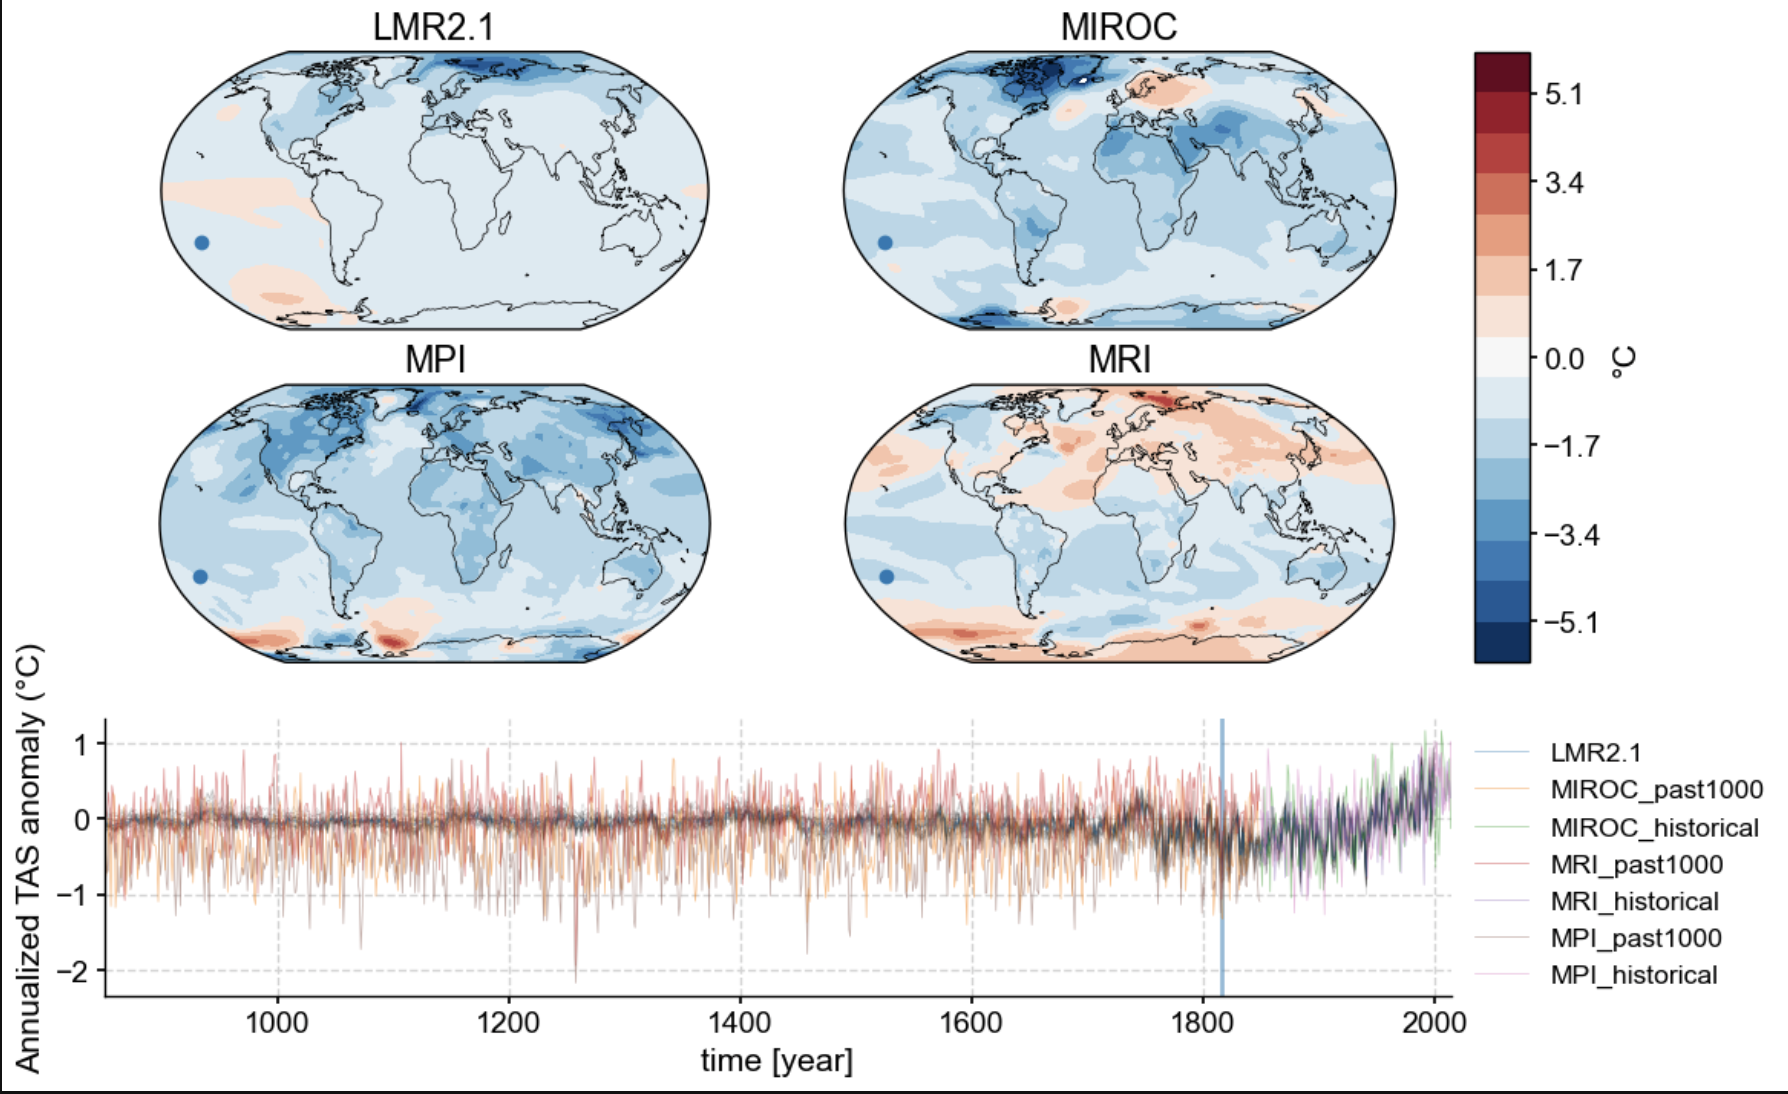
model output LMR CMIP6, xarray matplotlib cartopy pandas pyleoclim, Science Bits

proxy composite temperature, numpy seaborn pandas pyleoclim cfr, Science Bits
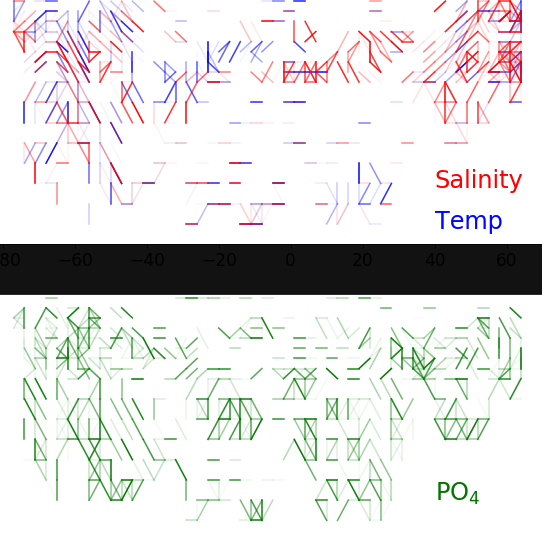
watermass geometry tracers endmember mixing, basemap scipy matplotlib pandas sqlalchemy, Science Bits
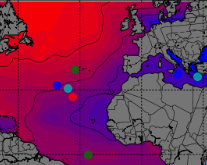
clustering watermass geometry, basemap scikit-learn matplotlib, Science Bits

data viz, matplotlib pyleoclim ammonyte, Main Analysis, published
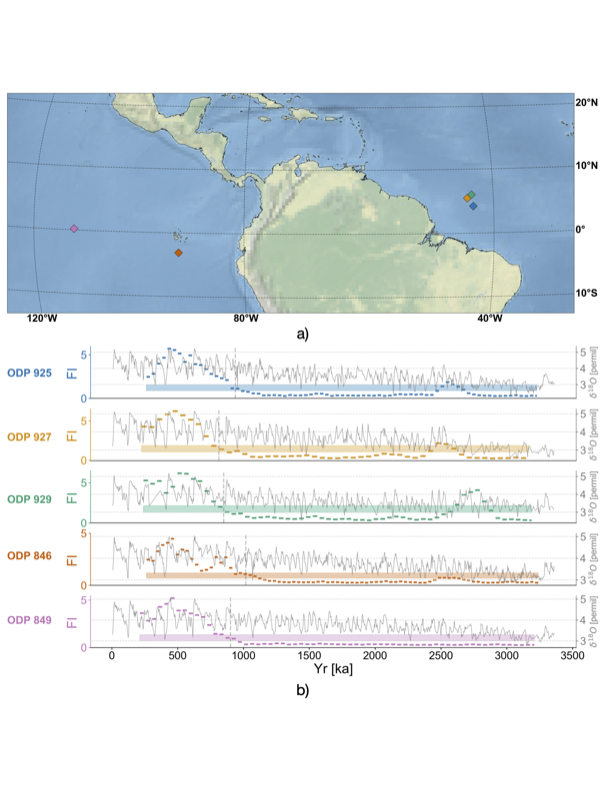
data viz, matplotlib pyleoclim ammonyte, Main Analysis, published
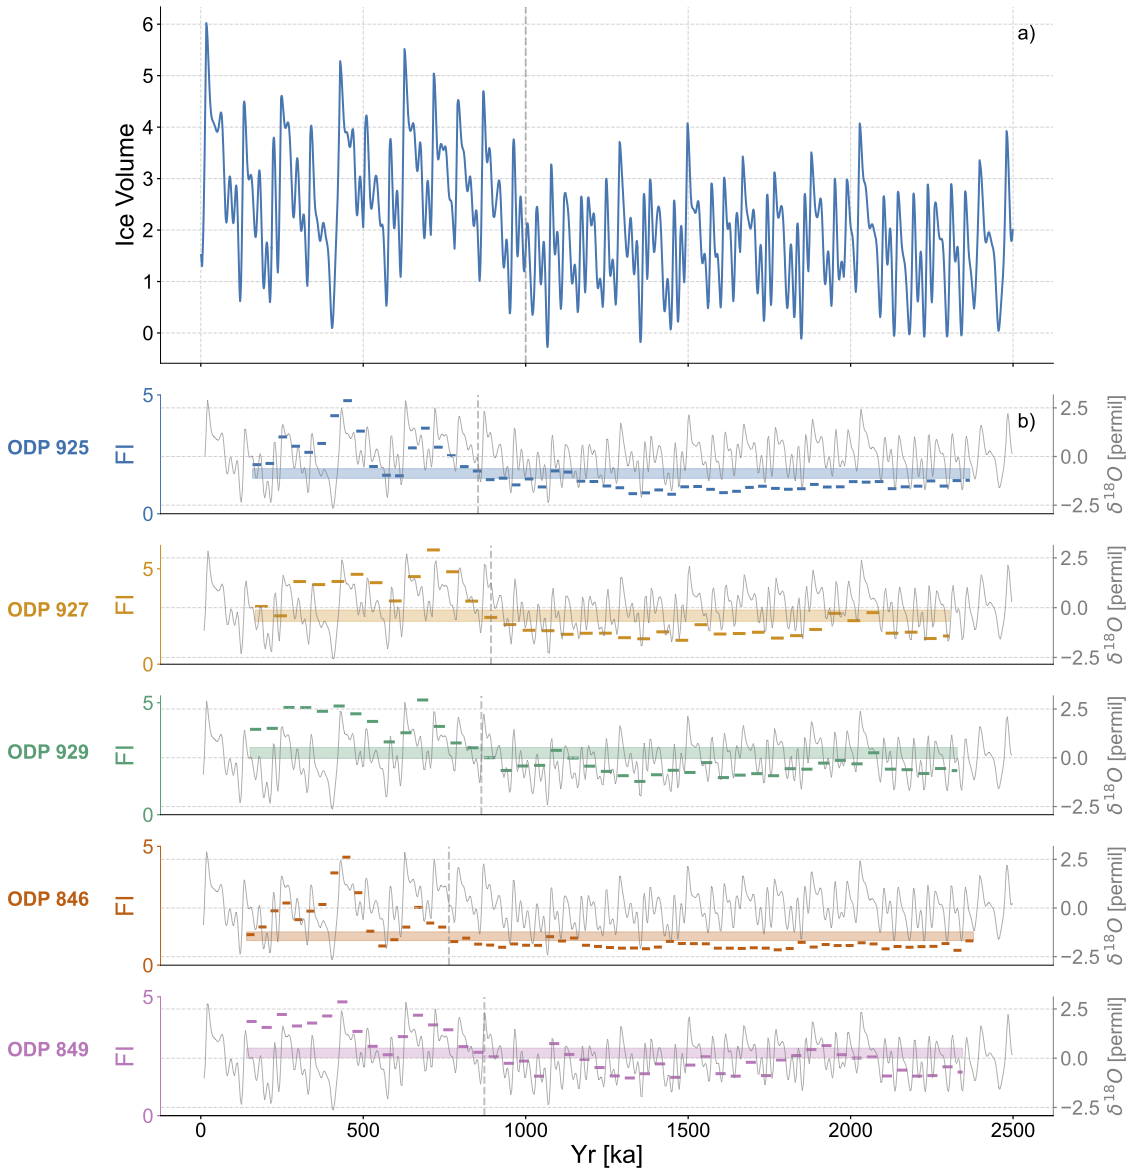
data viz, matplotlib pyleoclim ammonyte, Main Analysis, published
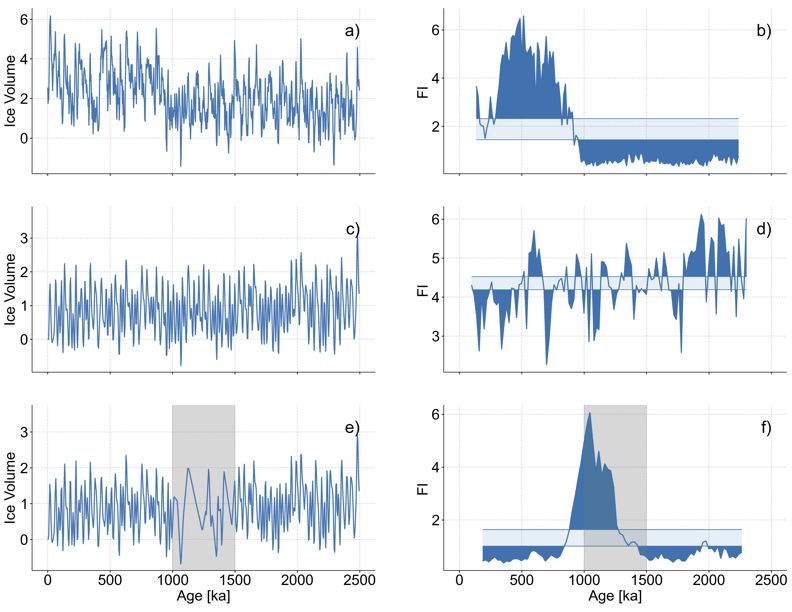
data viz, matplotlib pyleoclim ammonyte, Main Analysis, published
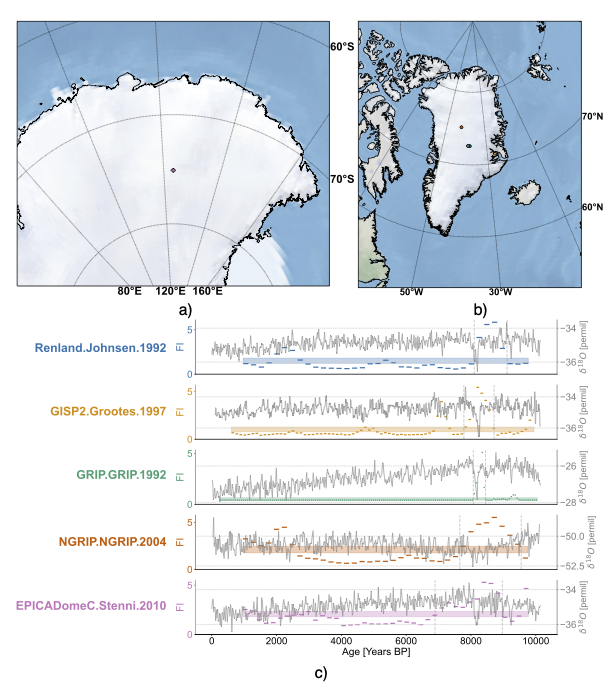
data viz, matplotlib pyleoclim ammonyte, Main Analysis, published
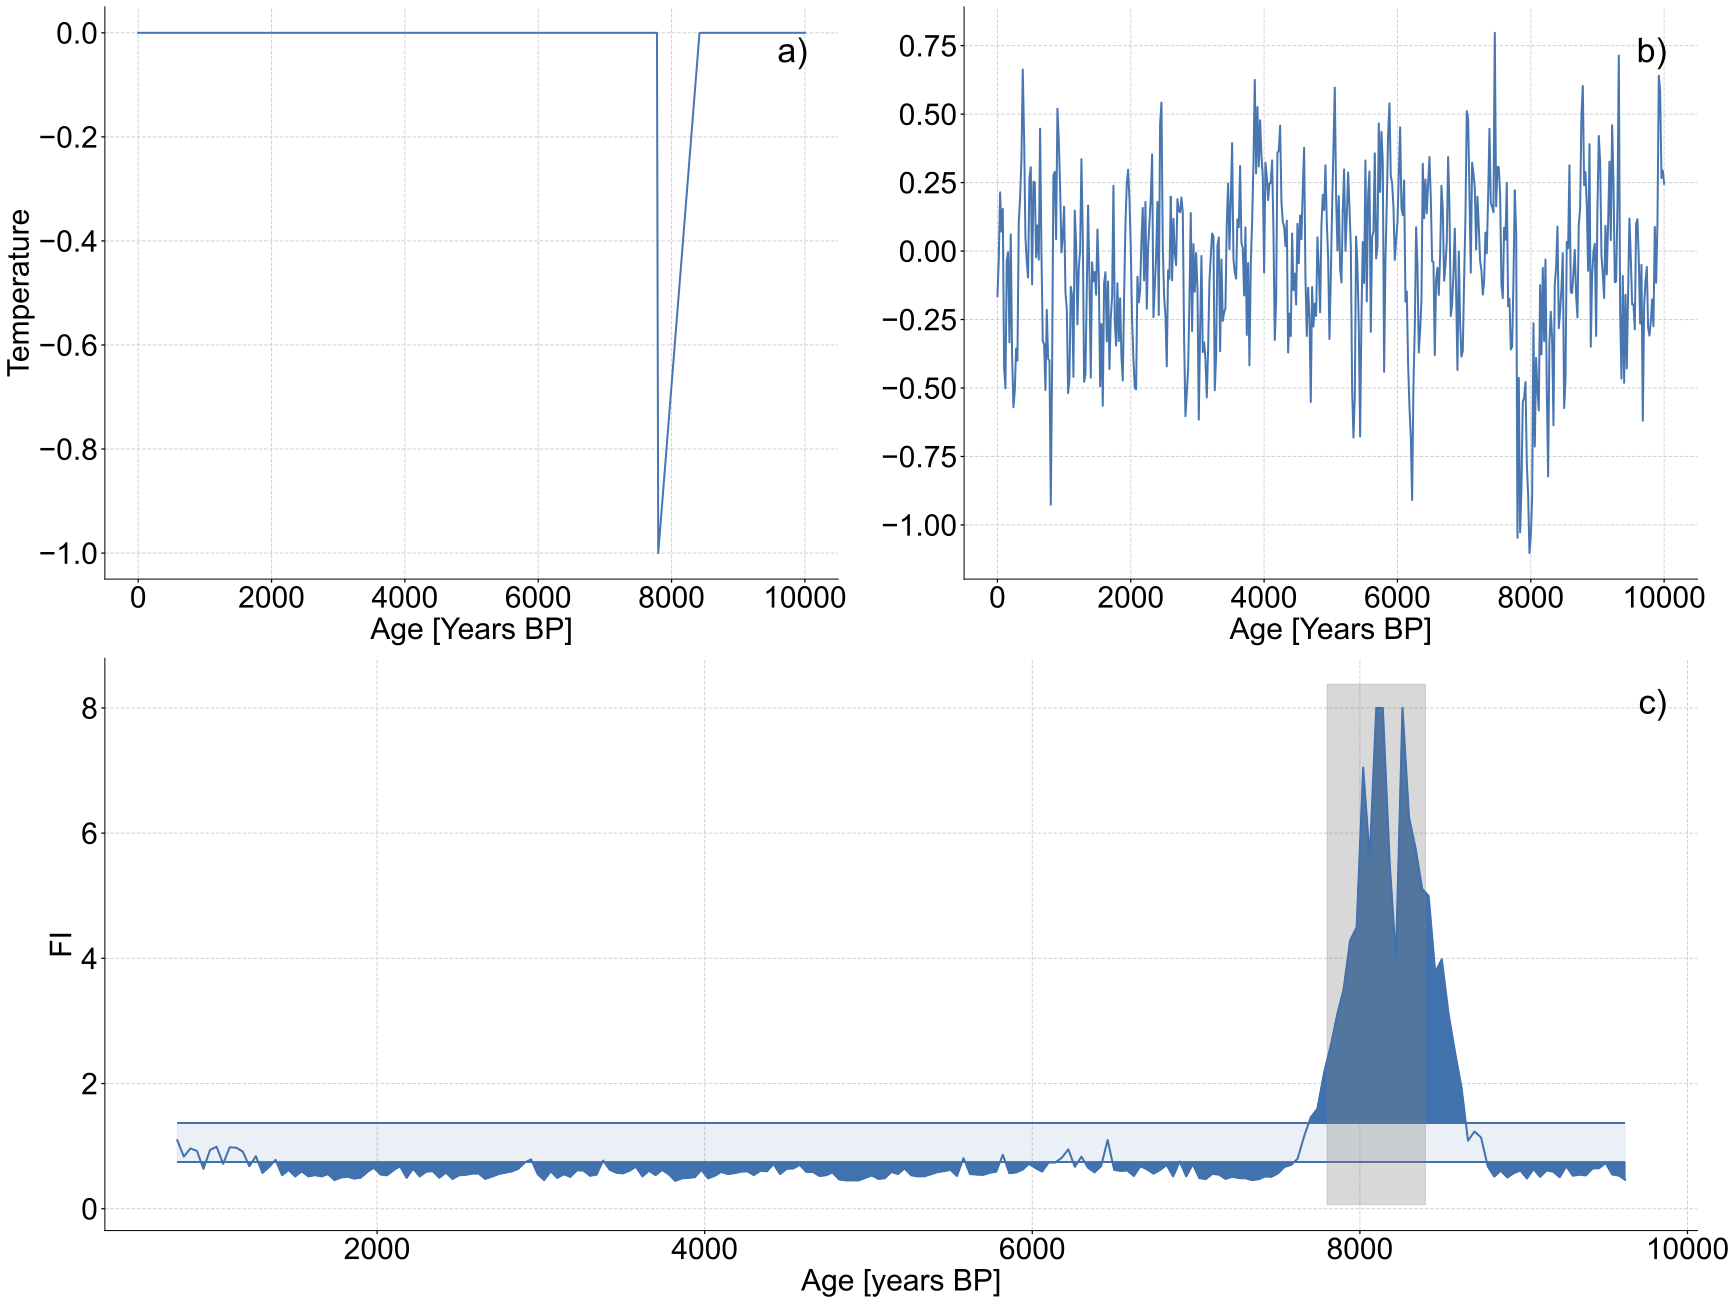
data viz, matplotlib pyleoclim ammonyte, Main Analysis, published

data viz, matplotlib pyleoclim ammonyte, Main Analysis, published
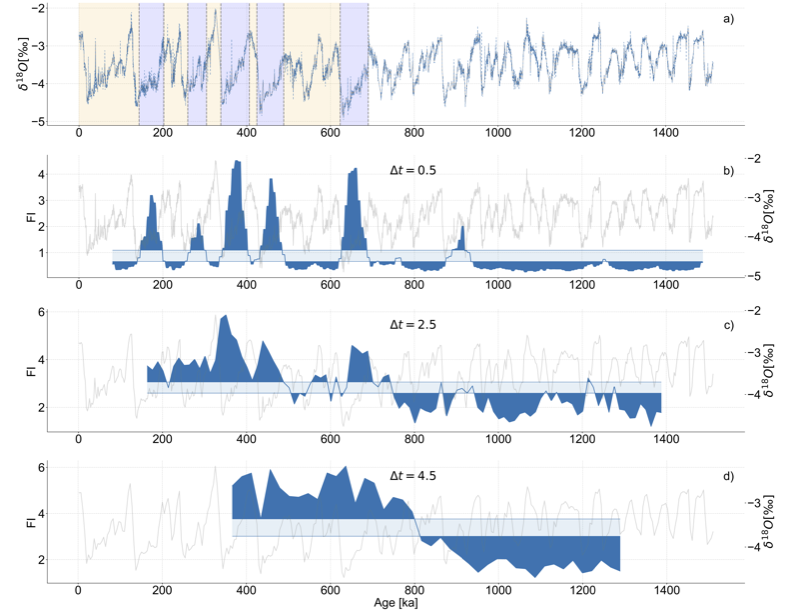
data viz, matplotlib pyleoclim ammonyte, Main Analysis, published

data viz, matplotlib pyleoclim ammonyte, Extras, published

data viz, matplotlib pyleoclim ammonyte, Extras, published

data viz, matplotlib pyleoclim ammonyte, Extras, published
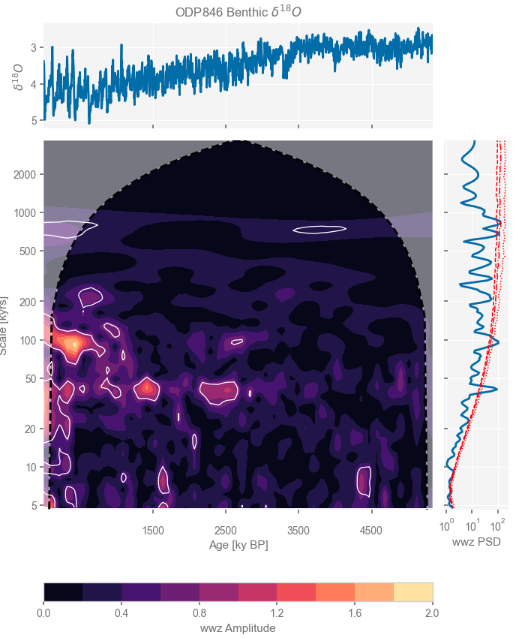
spectral analysis wavelet analysis cross-wavelet analysis insolation paleoceanography, xarray pyleoclim pylipd climlab, Science Bits, published
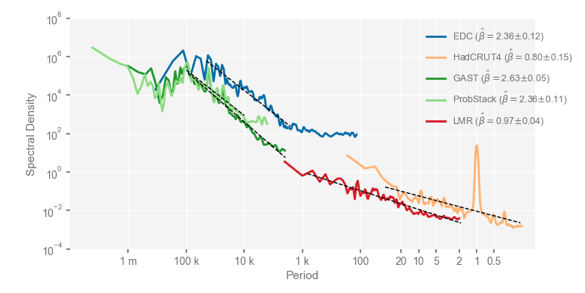
model output spectral analysis model-data comparison paleoclimate, xarray pyleoclim, Science Bits, published
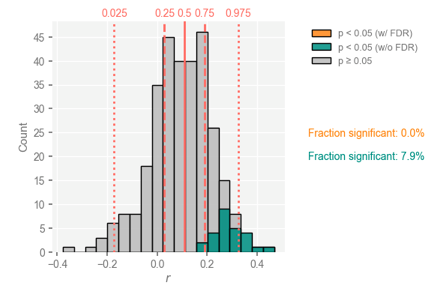
paleoclimate correlation age uncertainty, xarray pyleoclim cartopy pylipd, Science Bits, published
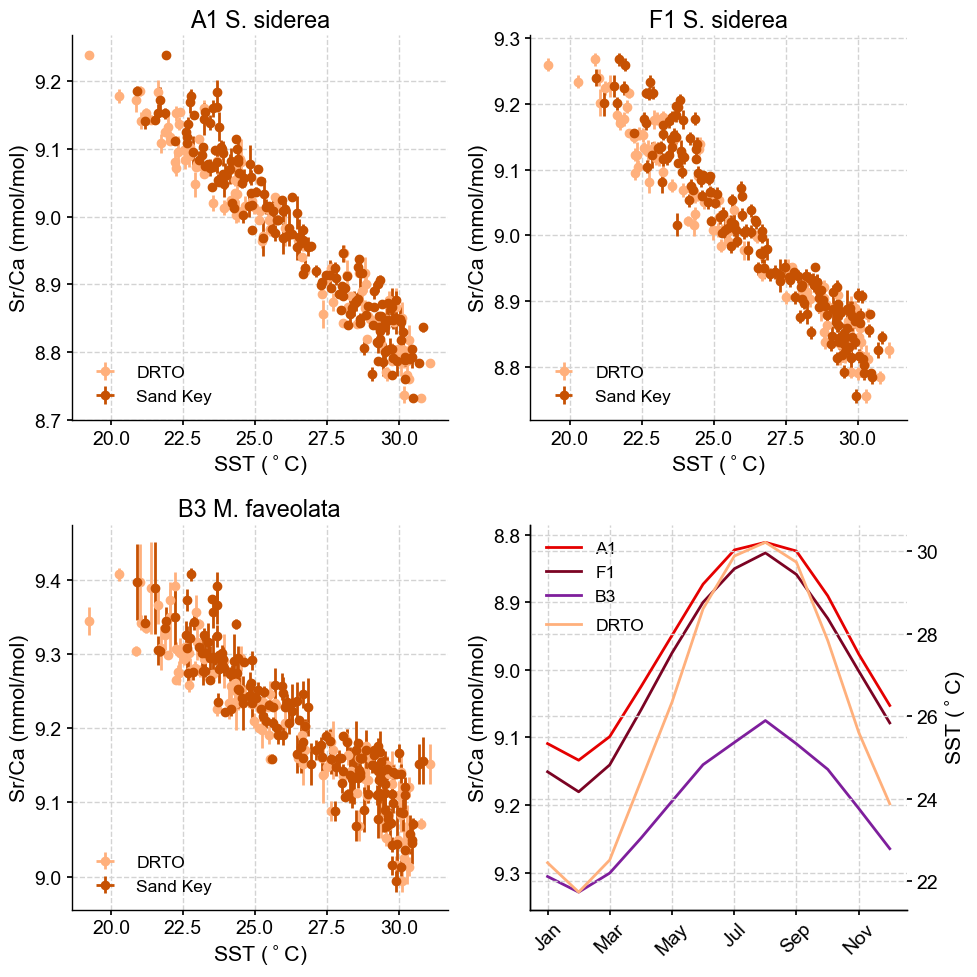
paleoceanography Sr/Ca coral calibration, matplotlib pyleoclim pandas, Getting Started

Statistics Calibration Paleocenography, statsmodel Great Tables, Calibration
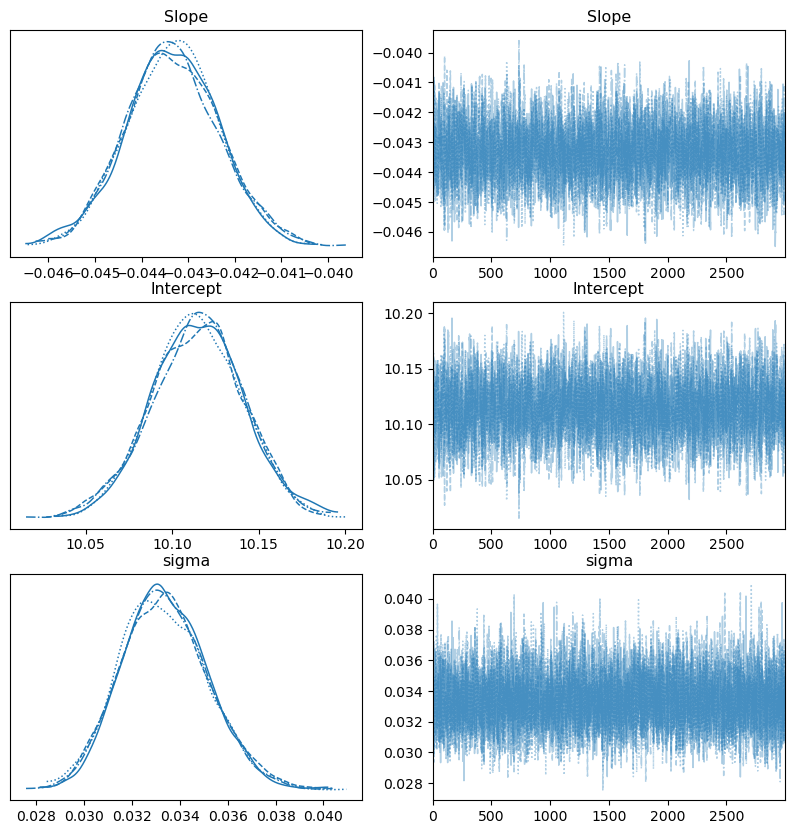
Bayesian Statistics Calibration Paleocenography, pymc arviz, Calibration
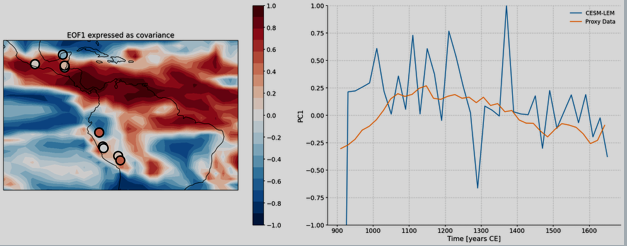
paleoceanography PCA modeling, xarray pyleoclim cartopy matplotlib pandas eofs, Science Bits
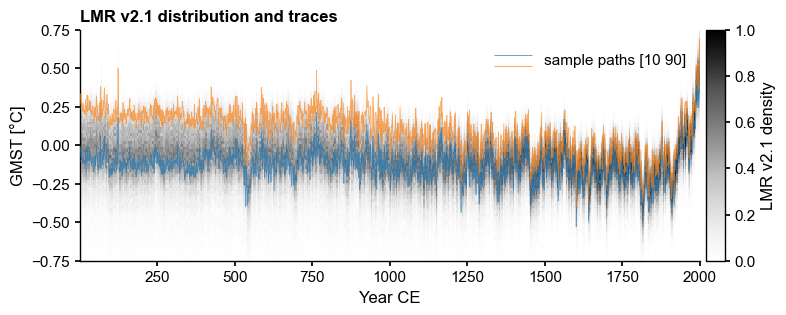
paleoclimatology data assimilation data viz, matplotlib pens pyleoclim, Motivation, published
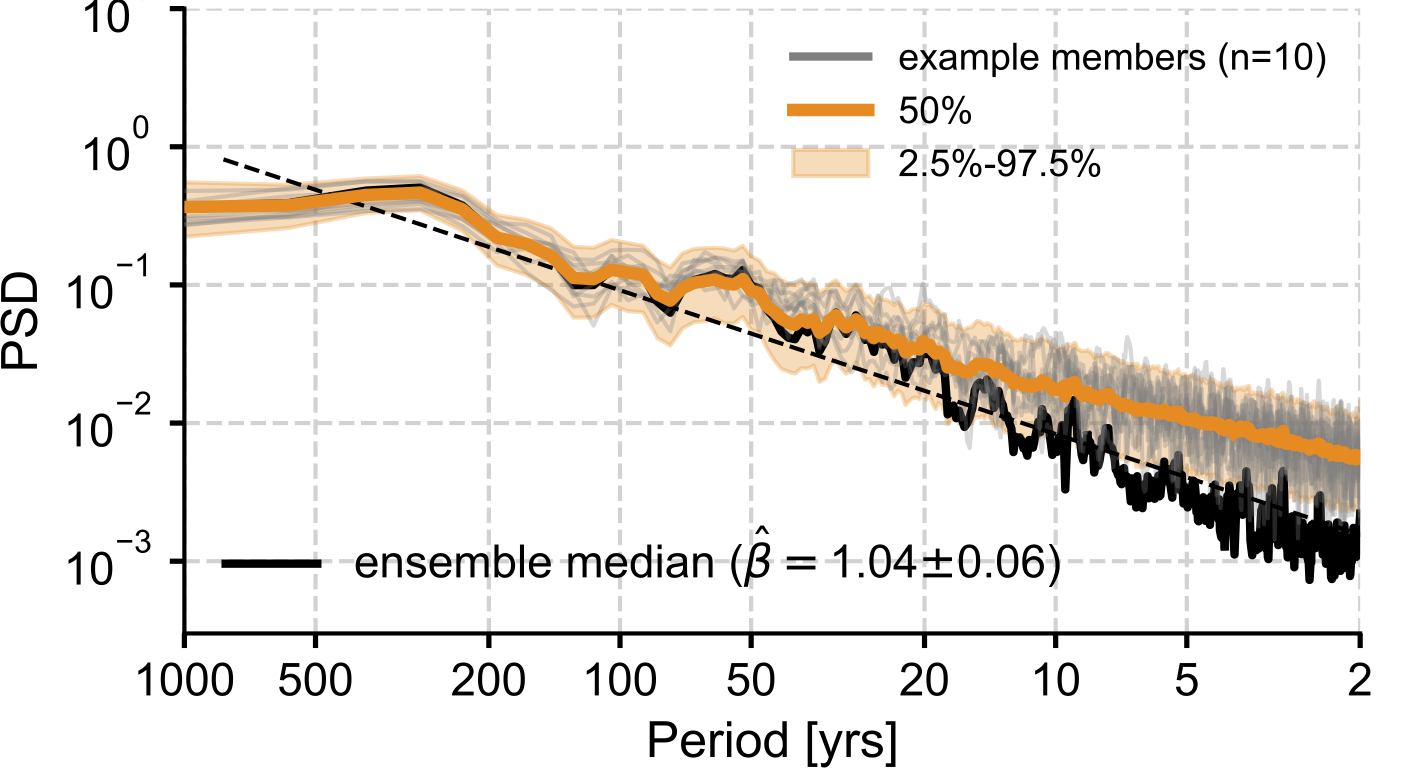
data assimilation PaMoDaCo, matplotlib pens, Temporal Interpretation, published
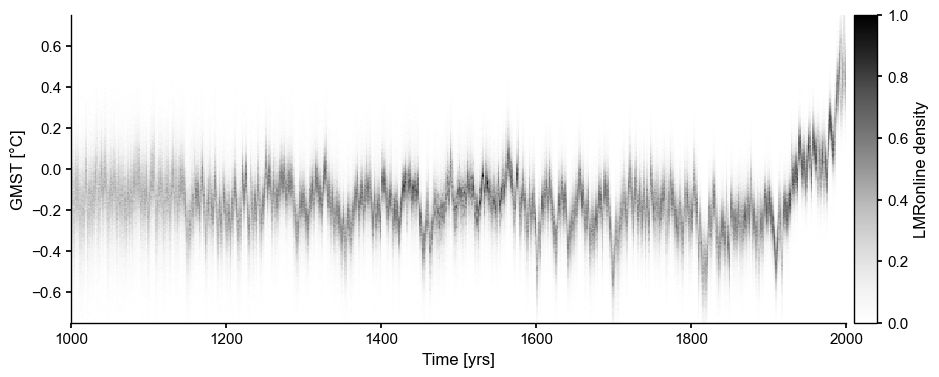
data assimilation timeseries modeling, matplotlib pens statsmodels seaborn, Temporal Interpretation, published
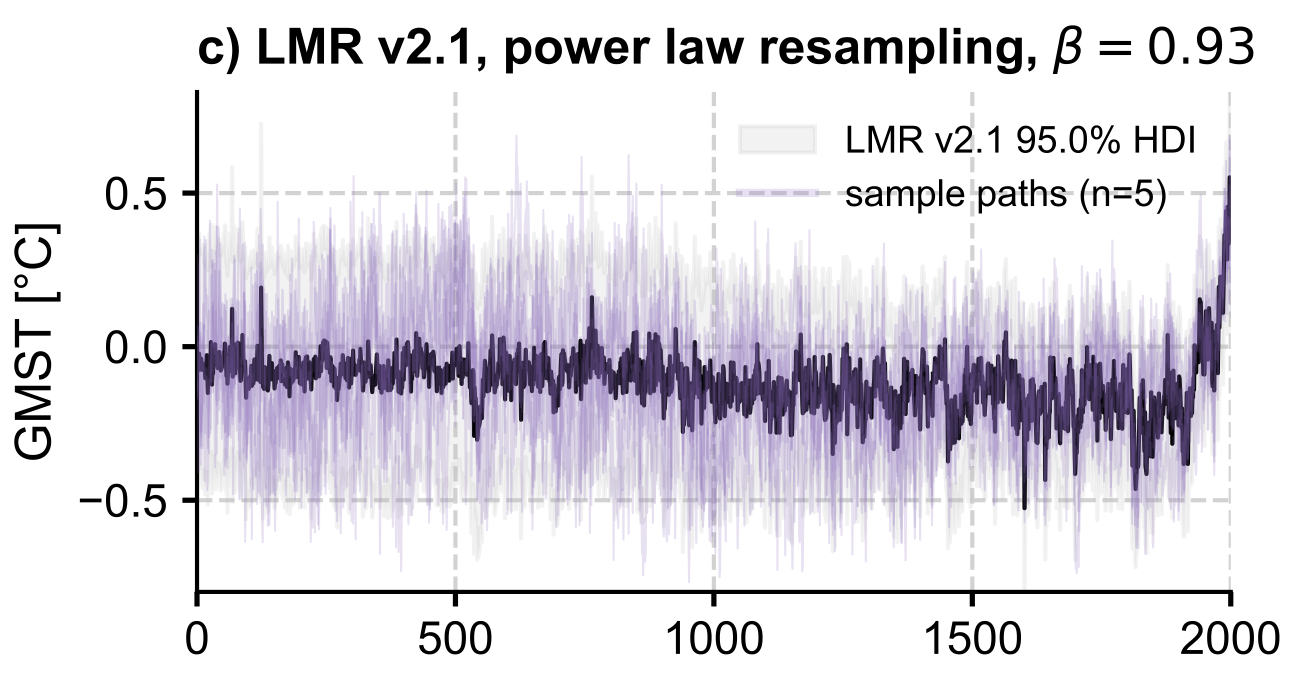
data assimilation timeseries modeling, matplotlib pens pyleoclim, Temporal Interpretation, published
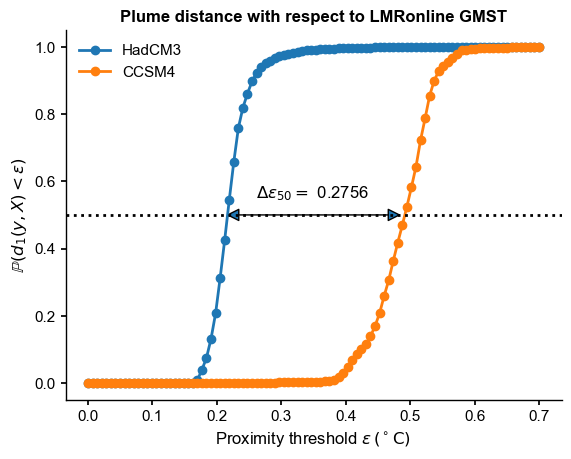
statistics PaMoDaCo, matplotlib pens seaborn, Plume Distance, published
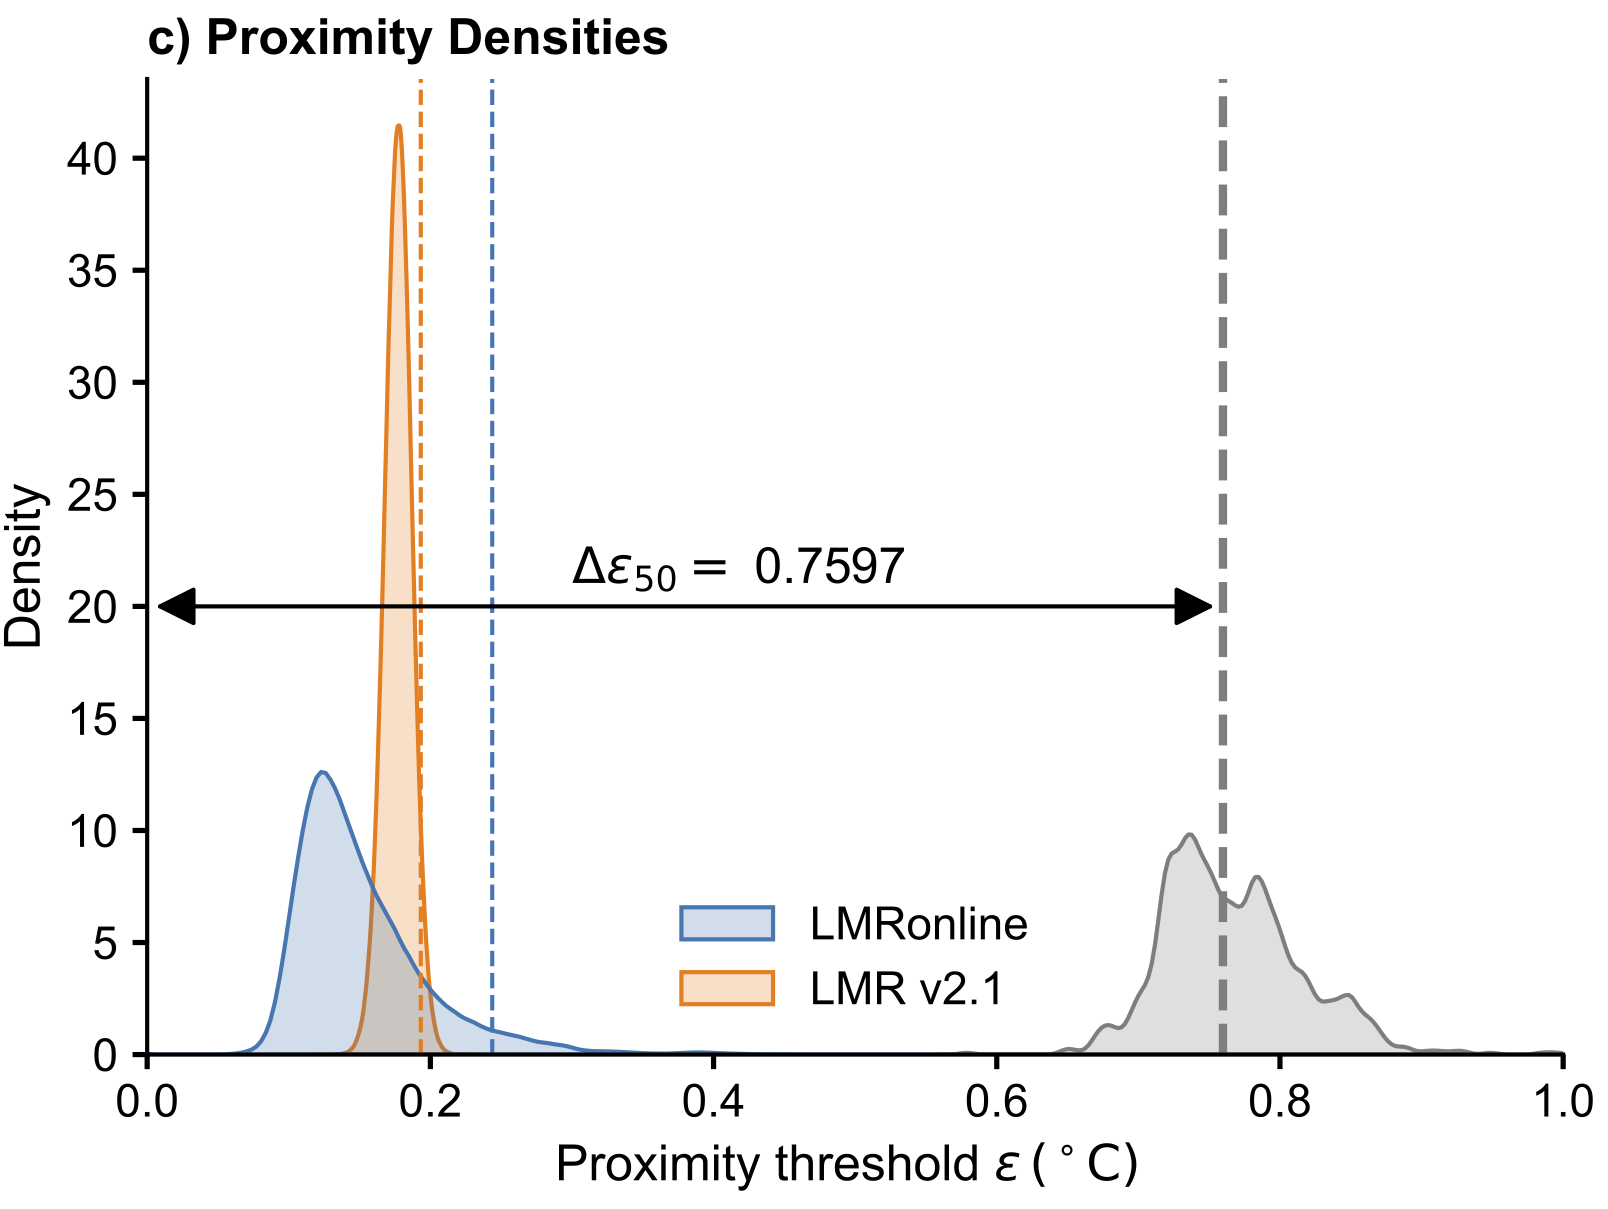
statistics PaMoDaCo, matplotlib pens seaborn, Plume Distance, published
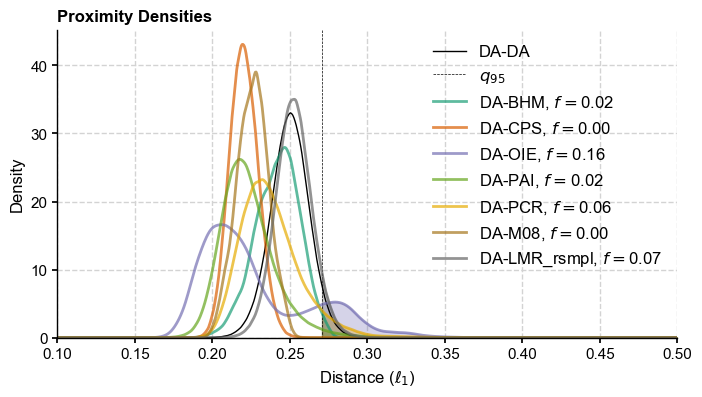
reconstruction statistics Common Era, matplotlib seaborn pens scipy, Paleoclimate Applications, published
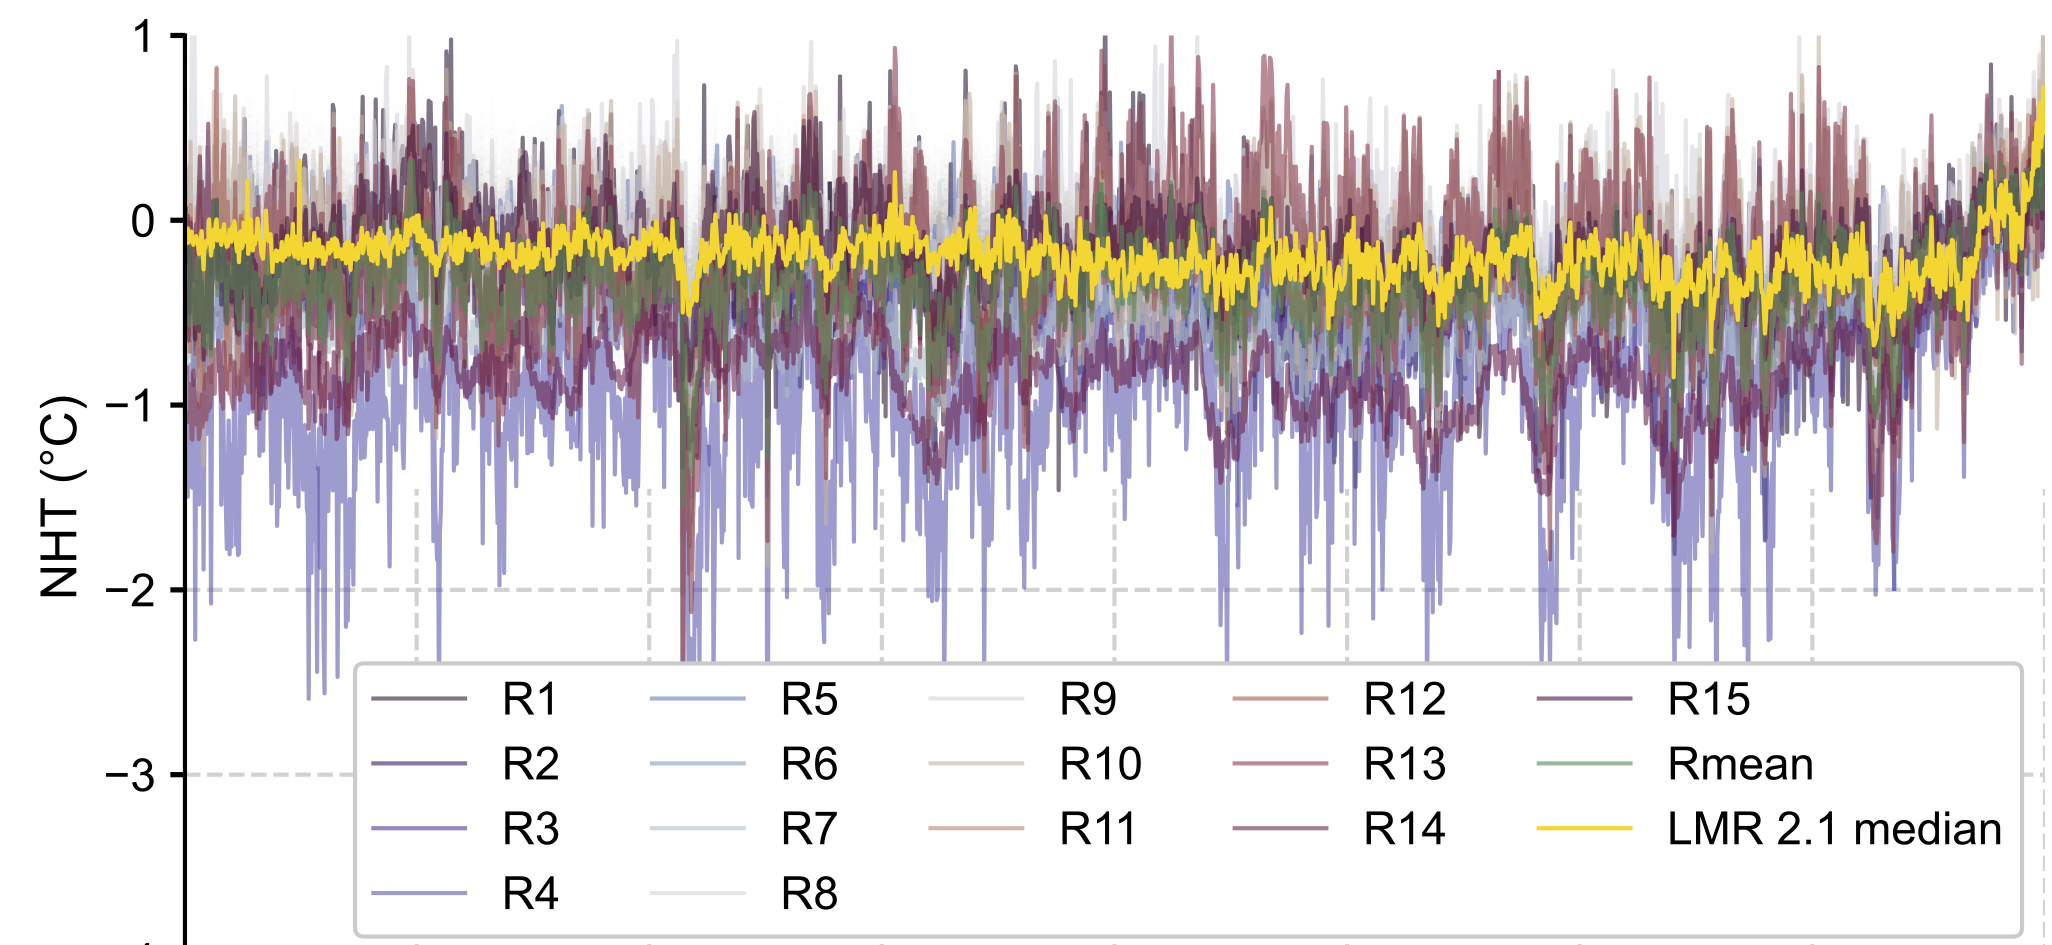
reconstruction statistics Common Era, matplotlib pens, Paleoclimate Applications, published
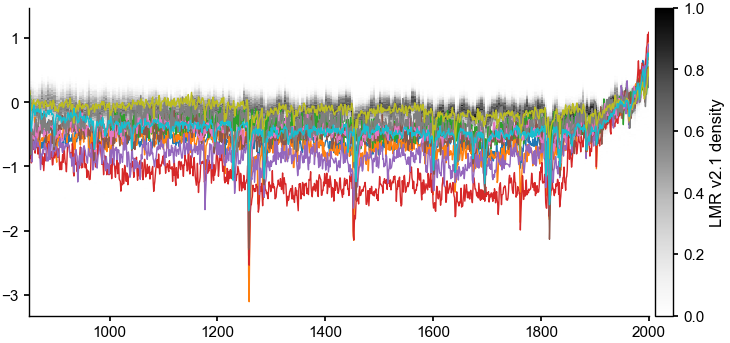
data assimilation PaMoDaCo PMIP, matplotlib pens pyleoclim pandas, Paleoclimate Applications, published

data wrangling, pyLiPD, Loading Data, published

data wrangling, pylipd pyleoclim, Loading Data, published
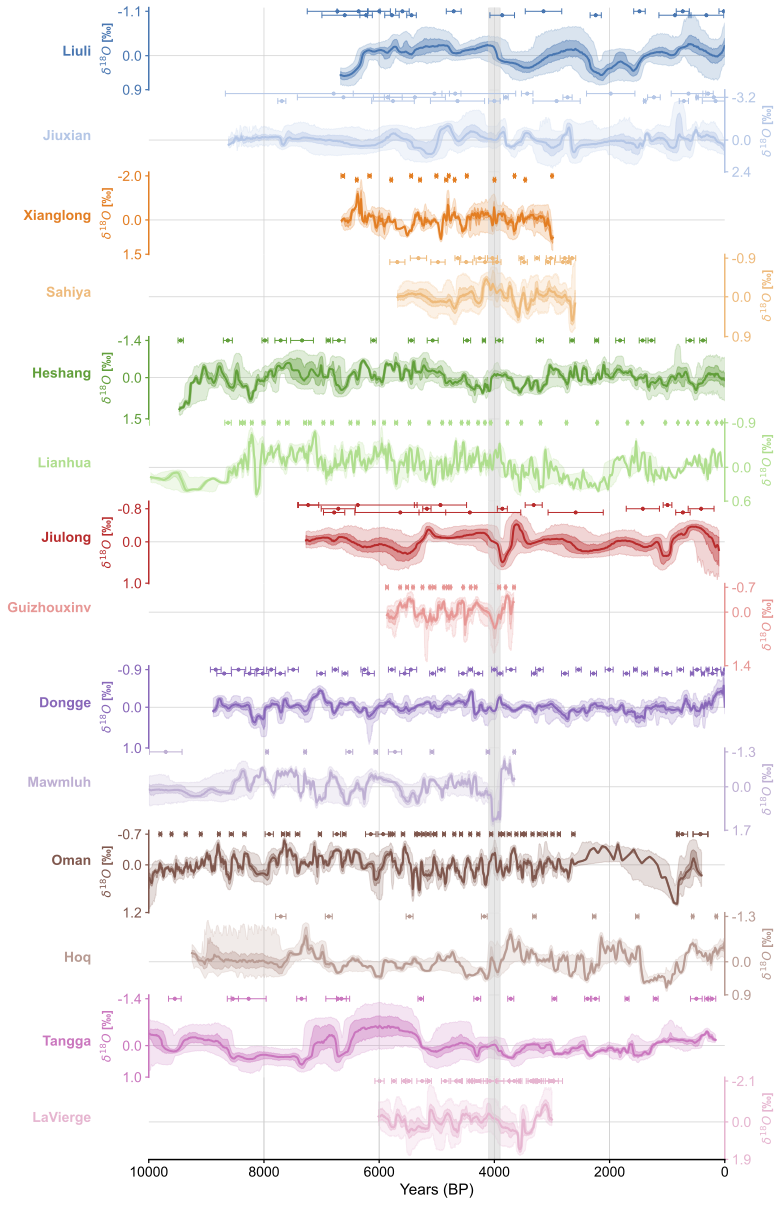
data viz data analysis, pyleoclim matplotlib, Exploring the Data, published

data viz data analysis, pyleoclim basemap, Exploring the Data, published
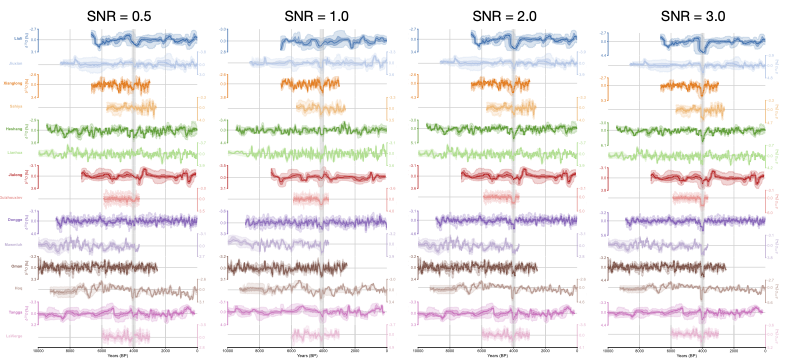
data viz data analysis, pyleoclim matplotlib, Main Analysis, published
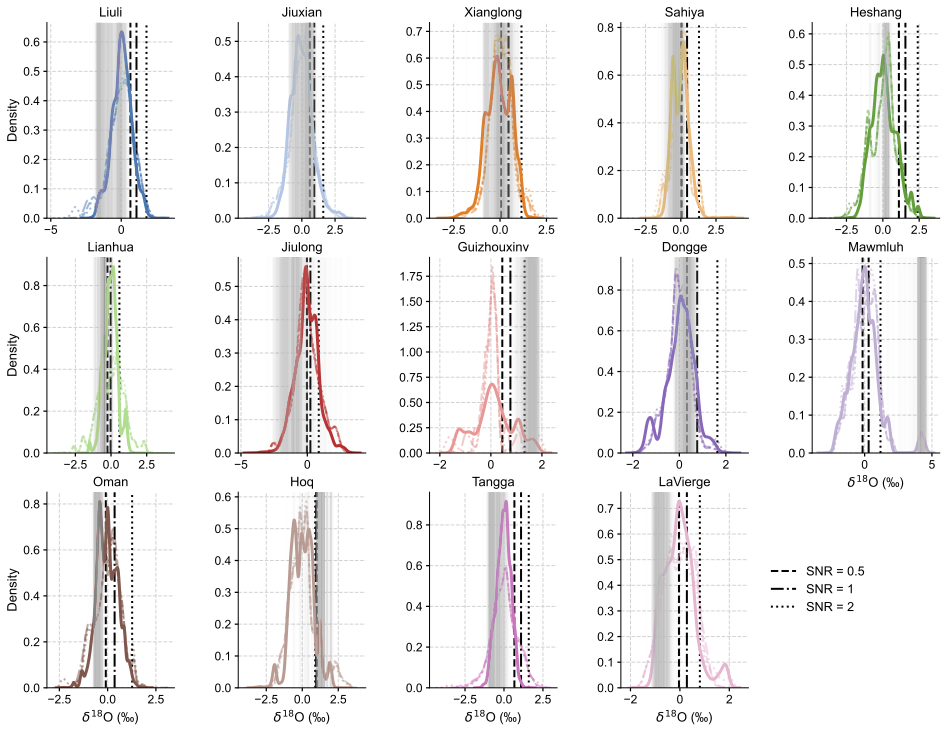
data analysis data viz, matplotlib pyleoclim, Main Analysis, published
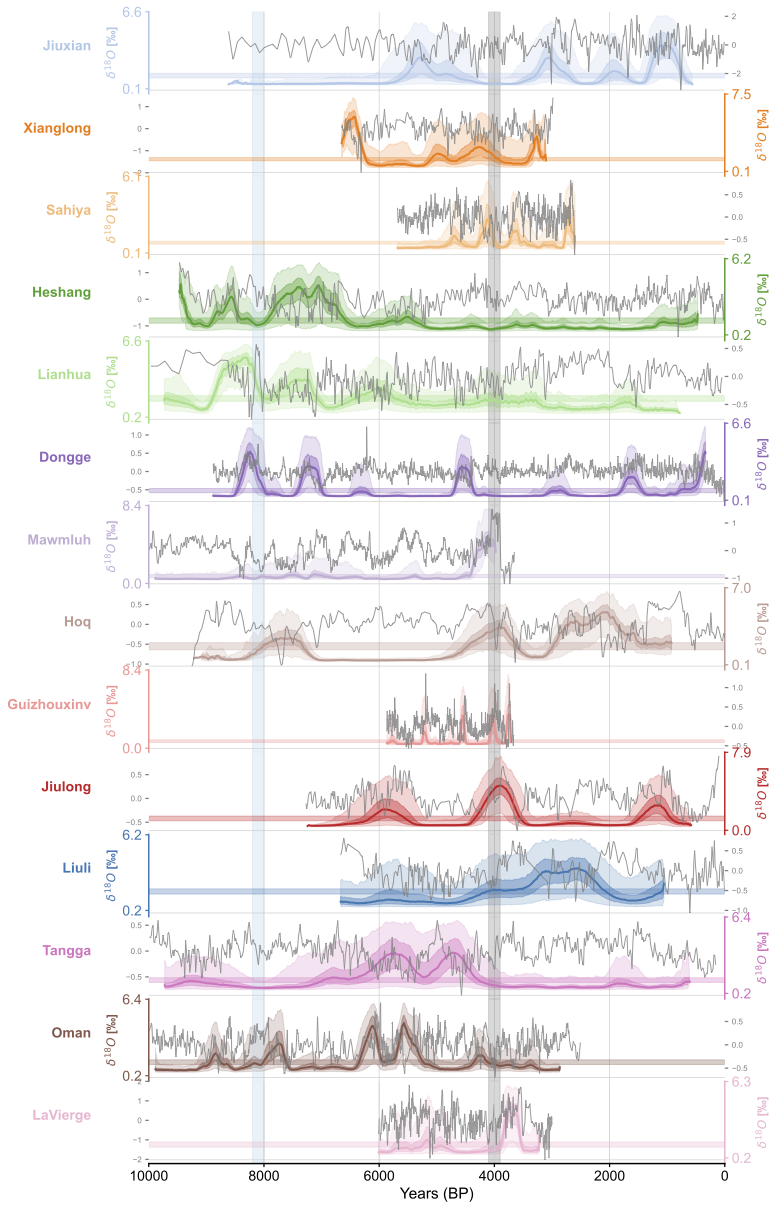
data viz data analysis, pyleoclim ammonyte matplotlib, Main Analysis, published
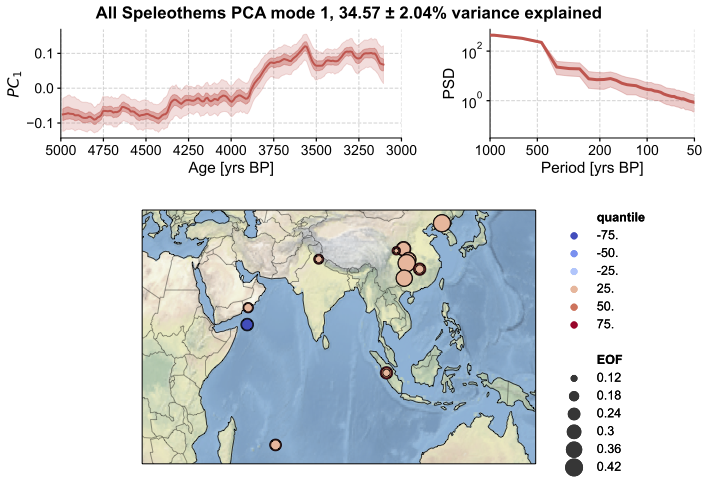
data viz data analysis, pyleoclim matplotlib, Main Analysis, published
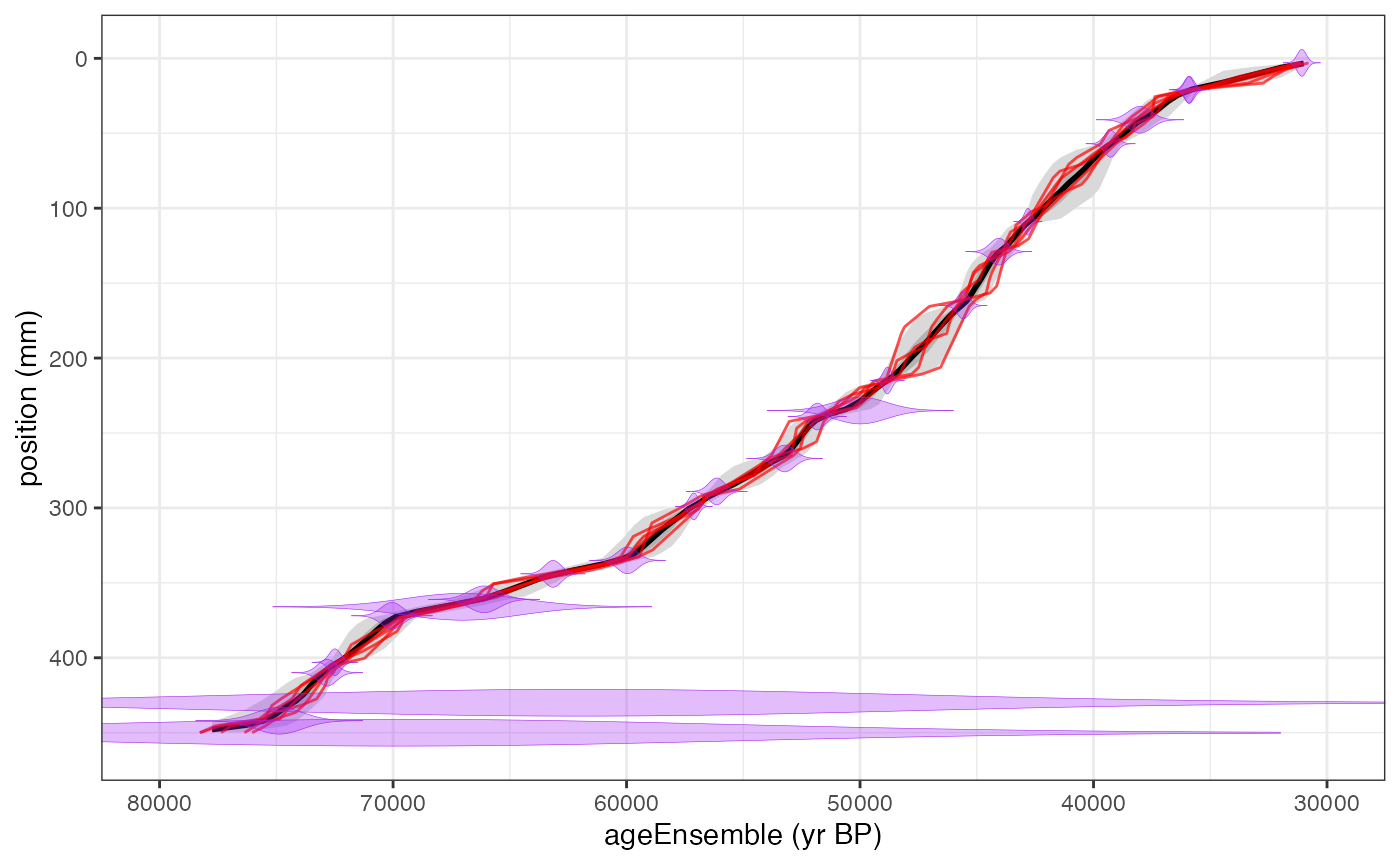
age modeling uncertainty quantification, geoChronR lipdR, Core Methods, published

correlation age uncertainty, geoChronR ggplot2, Core Methods, published

regression calibration, geoChronR readr ggplot2, Core Methods, published
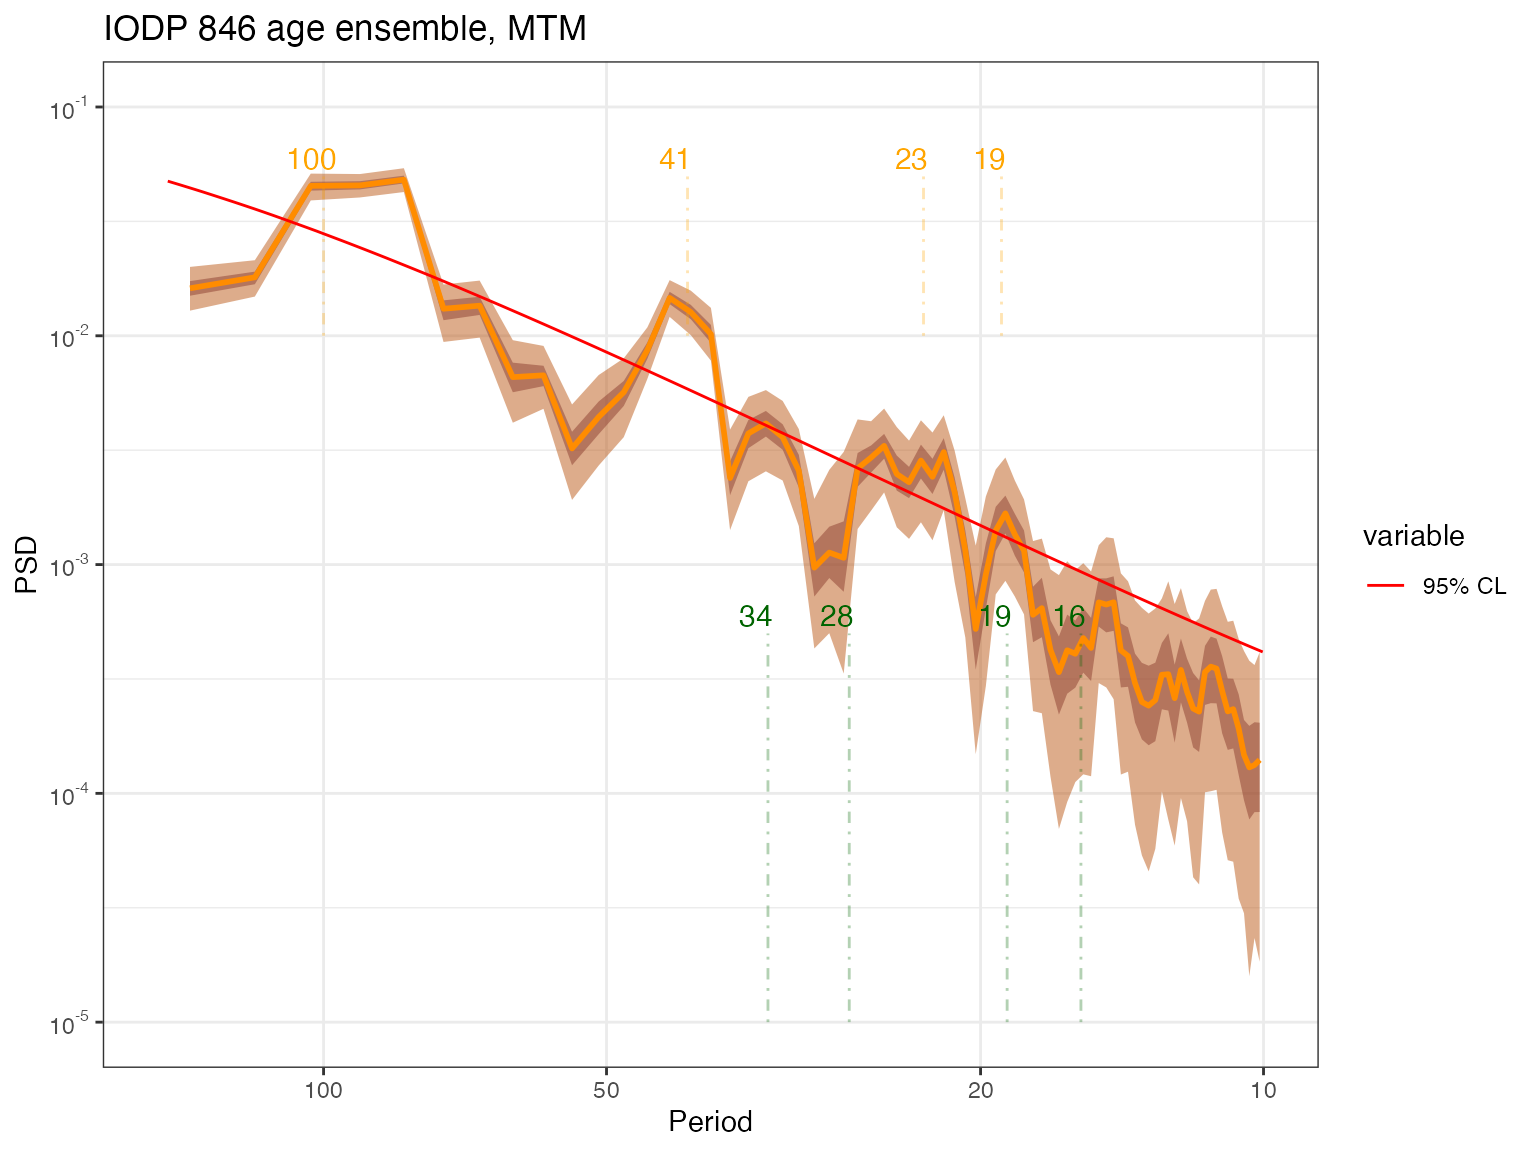
spectral analysis wavelets, geoChronR, Core Methods, published

PCA dimension reduction, geoChronR, Core Methods, published
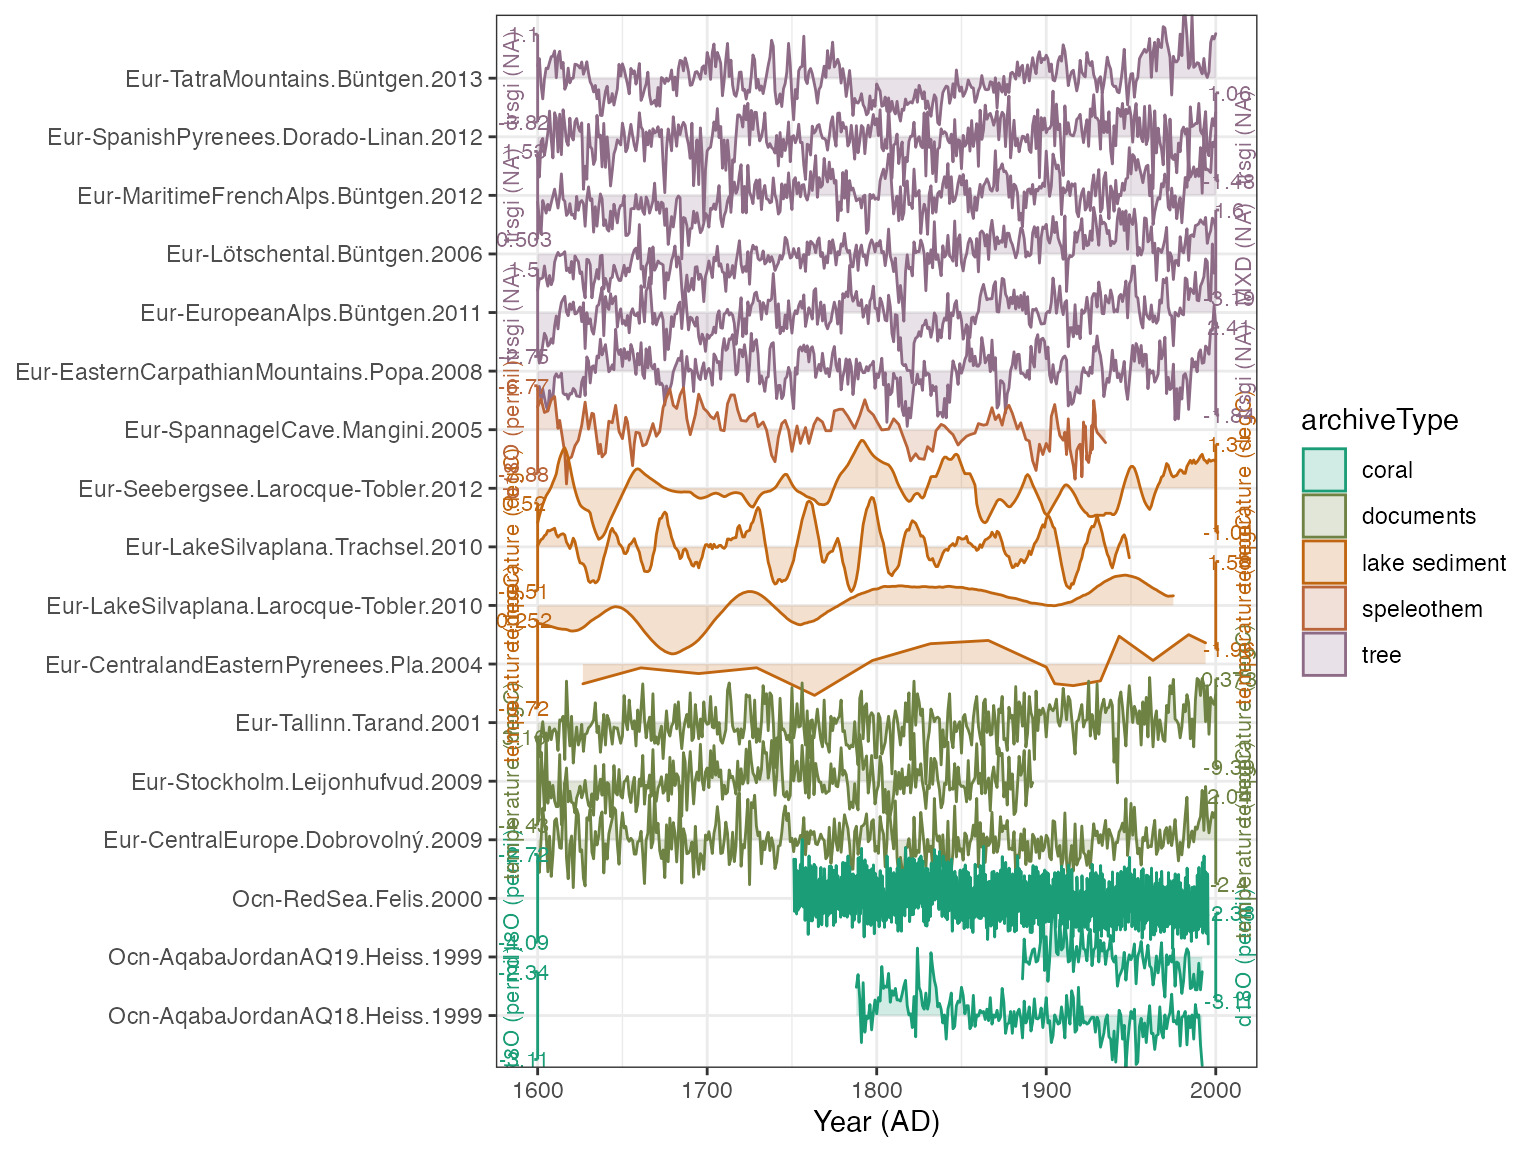
visualization, geoChronR ggplot2, Data Manipulation, published
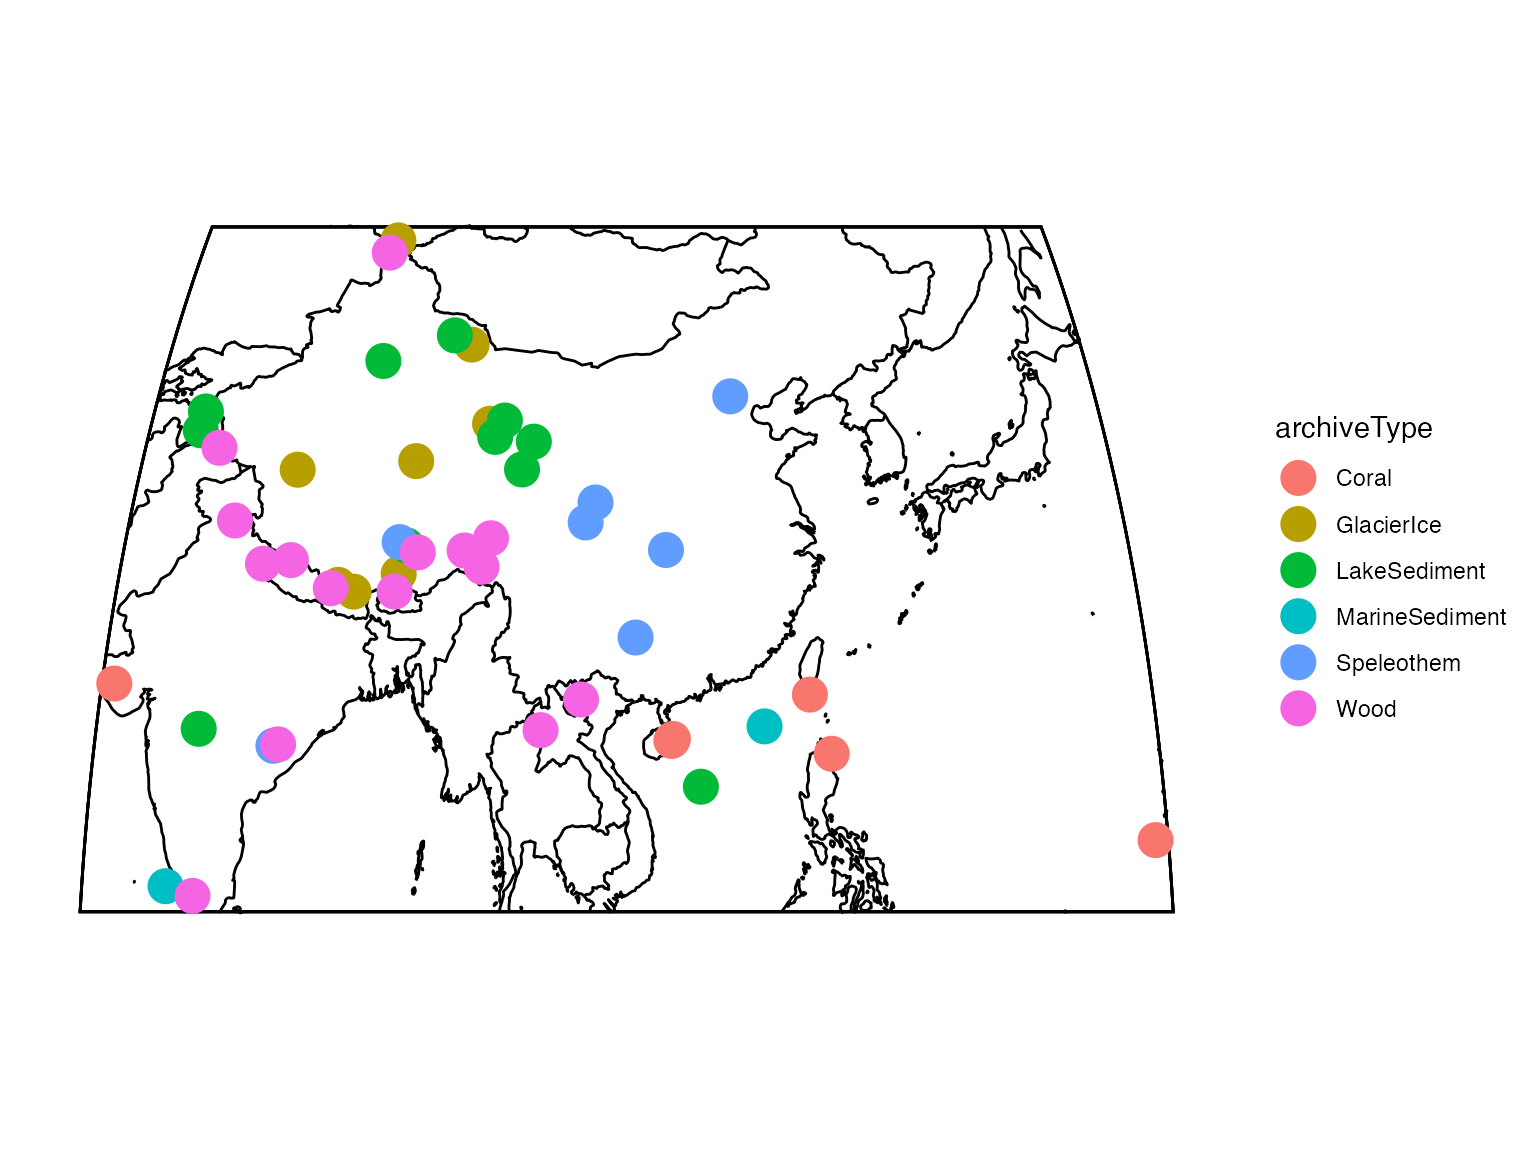
data wrangling mapping, geoChronR, Data Manipulation, published
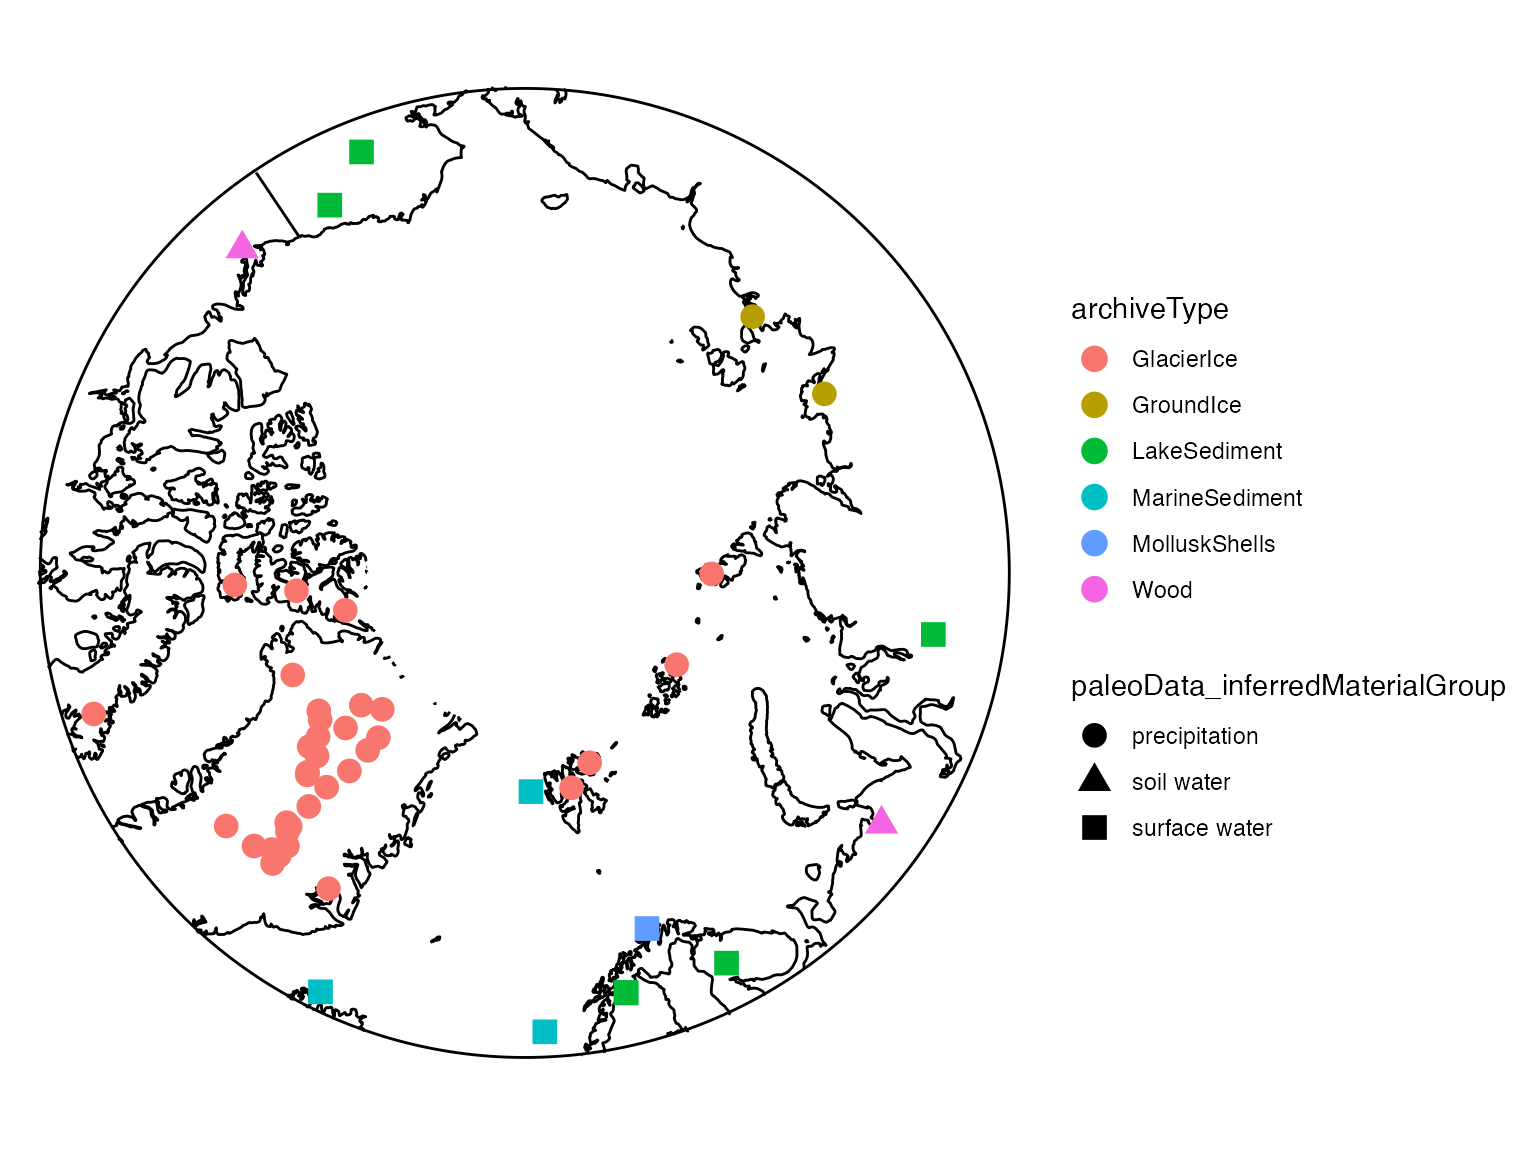
data wrangling tidyverse, geoChronR dplyr purrr, Data Manipulation, published
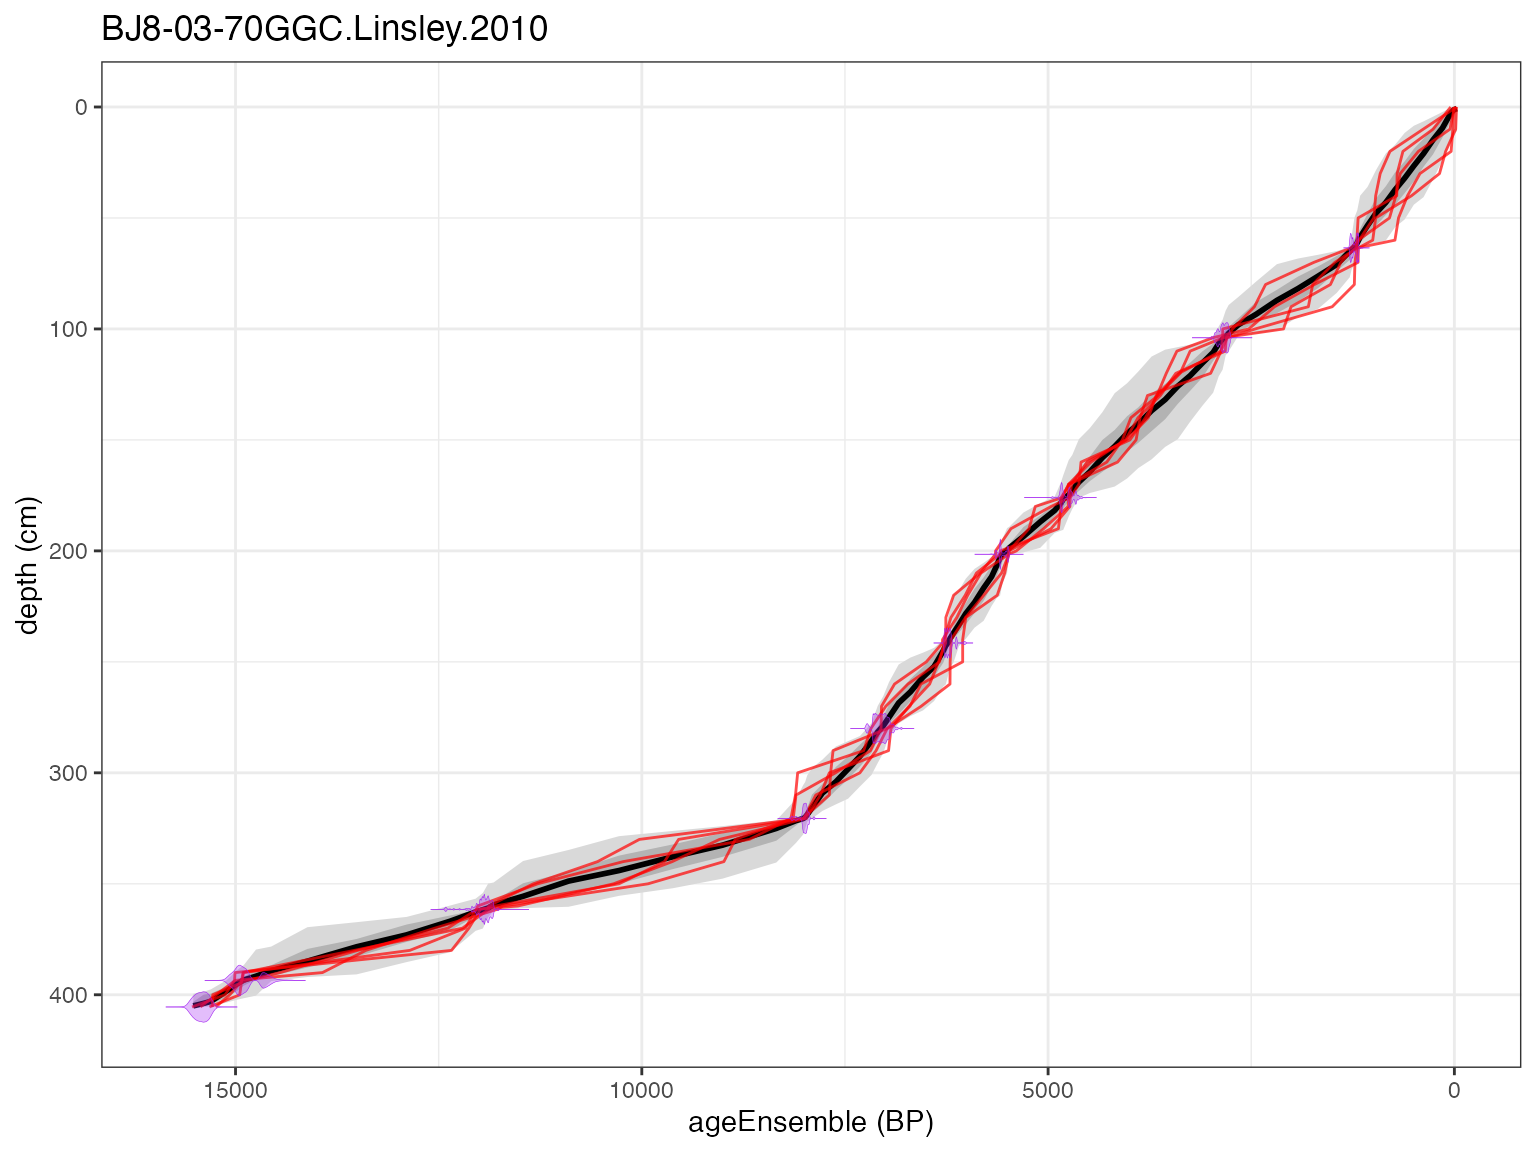
age modeling, geoChronR oxcAAR, Extensions, published
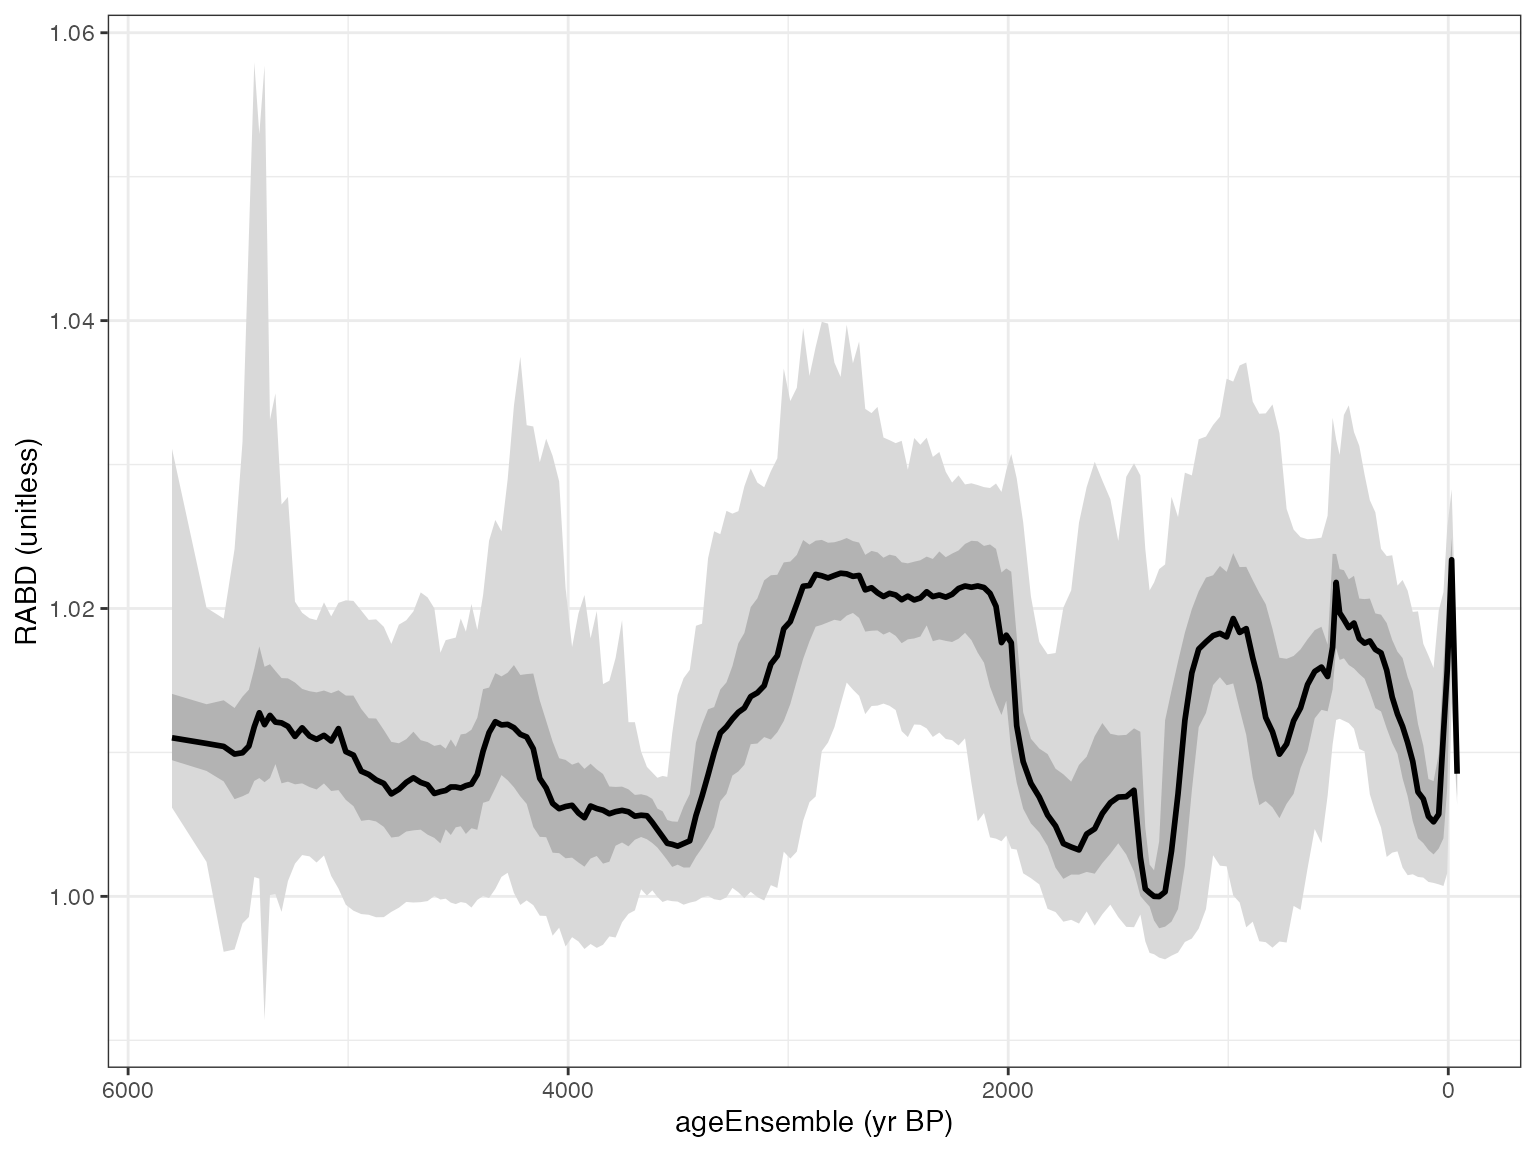
LiPD ensemble, geoChronR, Extensions, published

data wrangling, pylipd pyleoclim, Exploring the Data, published
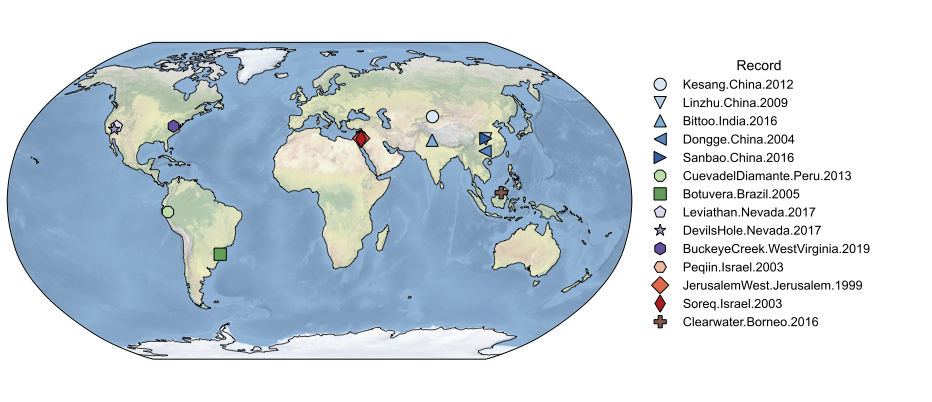
geospatial data viz, cartopy pyleoclim matplotlib, Exploring the Data, published
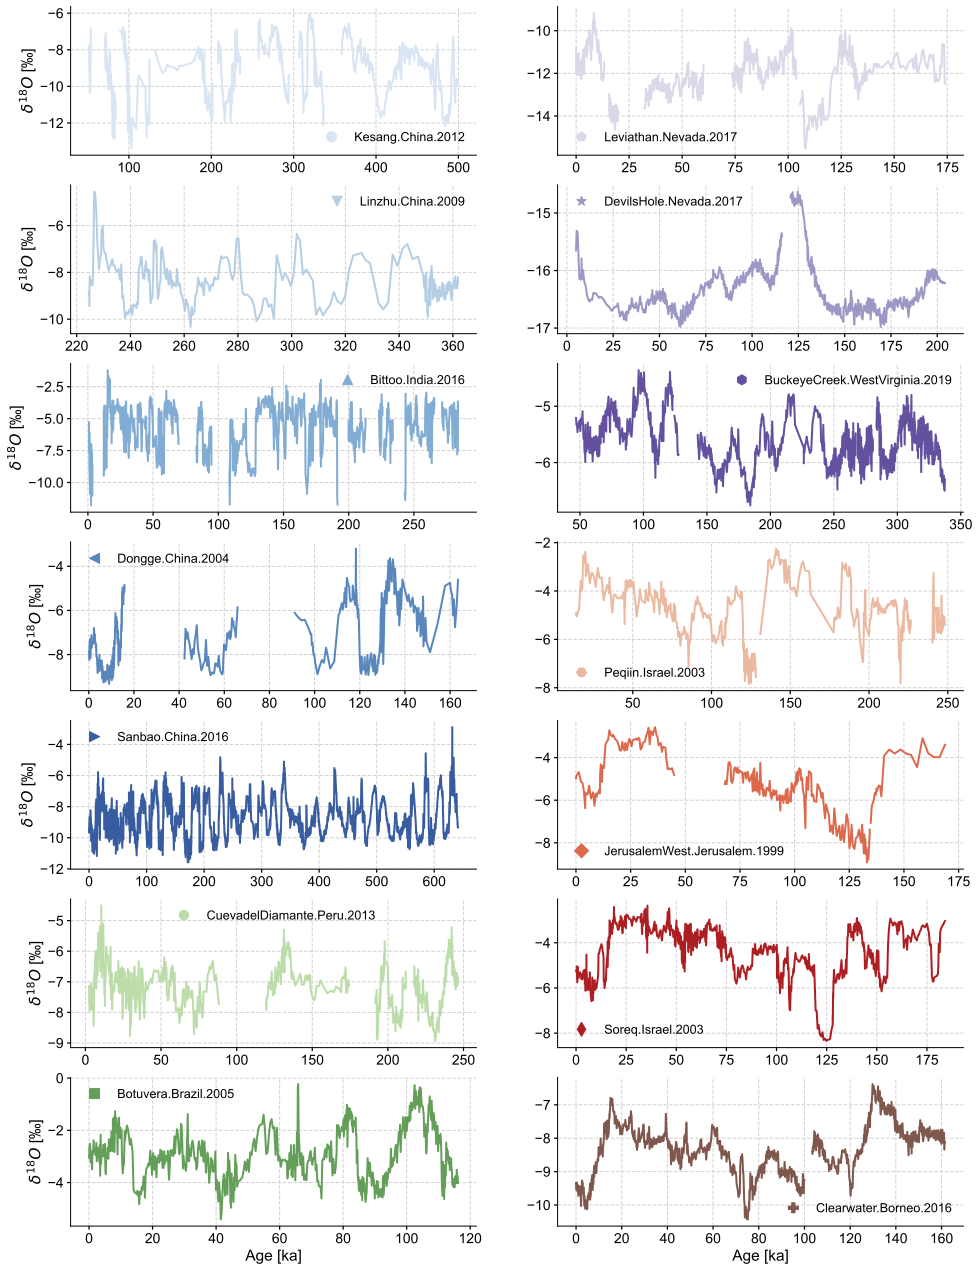
data viz, matplotlib pyleoclim, Exploring the Data, published
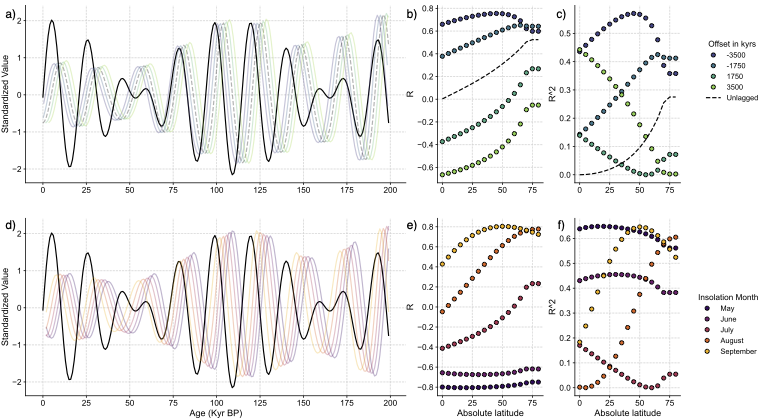
data viz data analysis, pyleoclim matplotlib climlab, Heuristic Examples, published

paleoclimate data analysis data viz, matplotlib climlab pyleoclim, Heuristic Examples, published
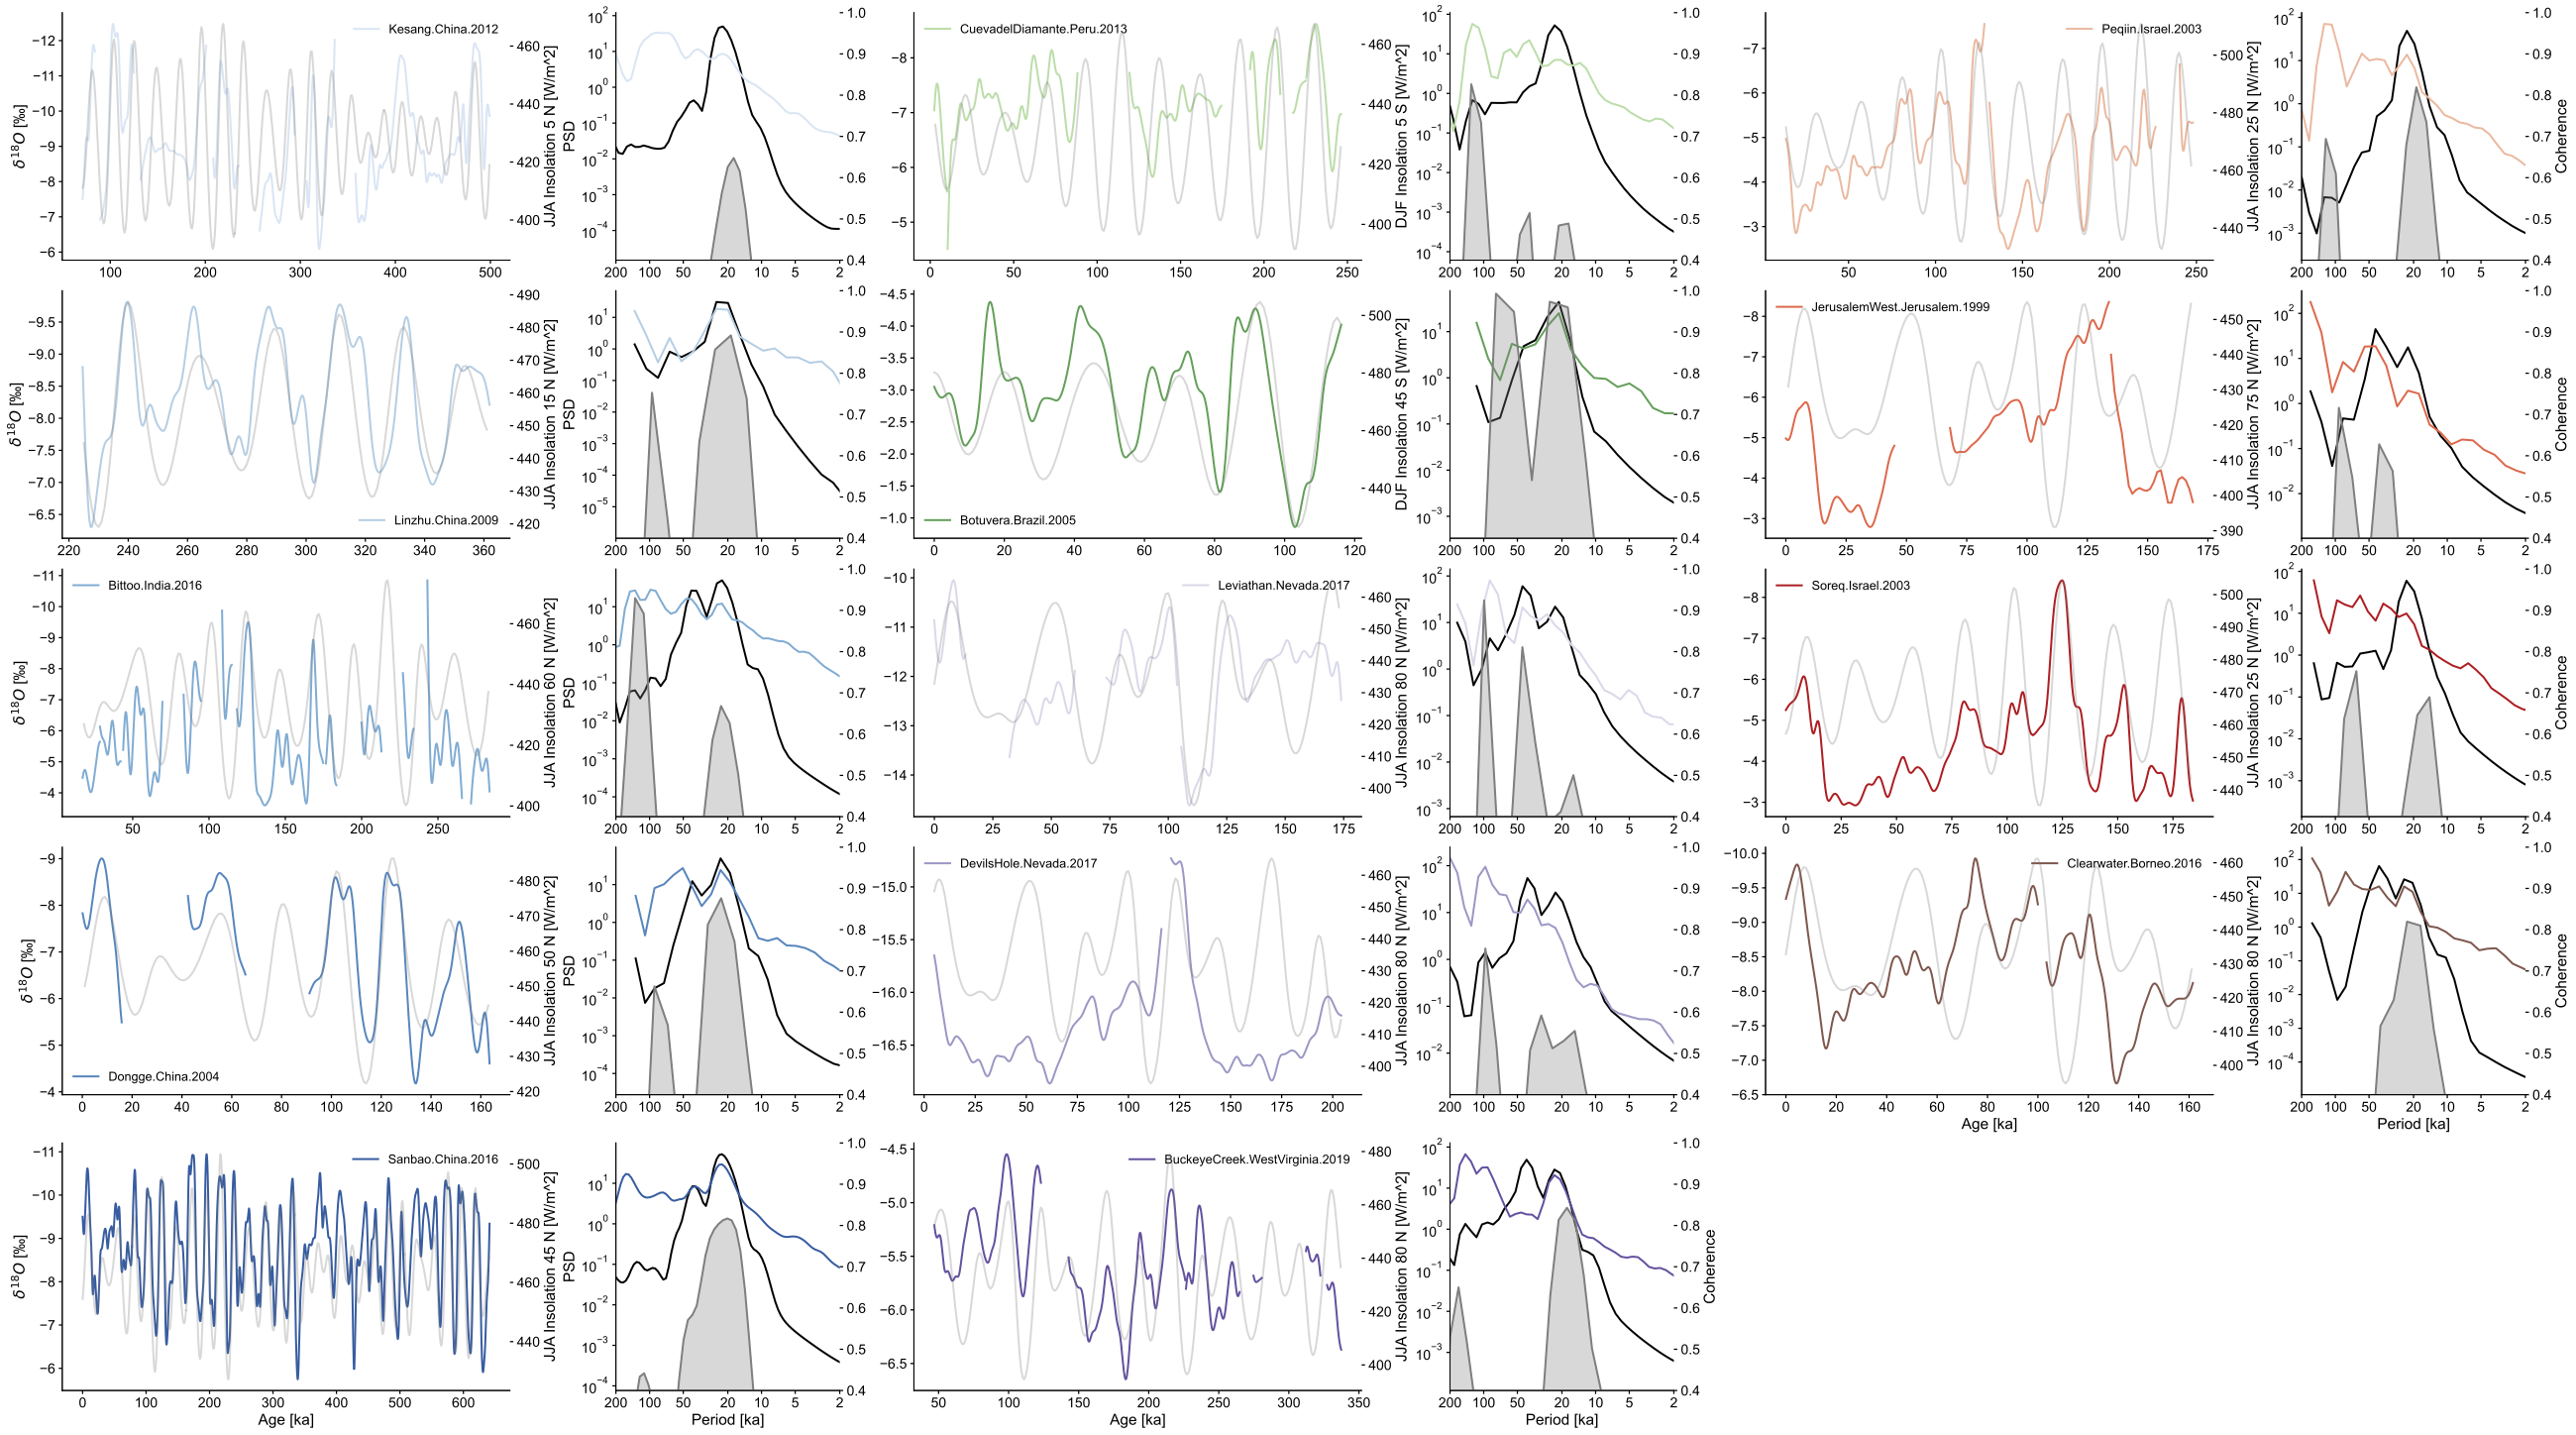
data viz data analysis paleoclimate, matplotlib pyleoclim climlab, Global Coherence Analysis, published

paleoclimate signal processing, pyleoclim climlab matplotlib, Global Coherence Analysis, published
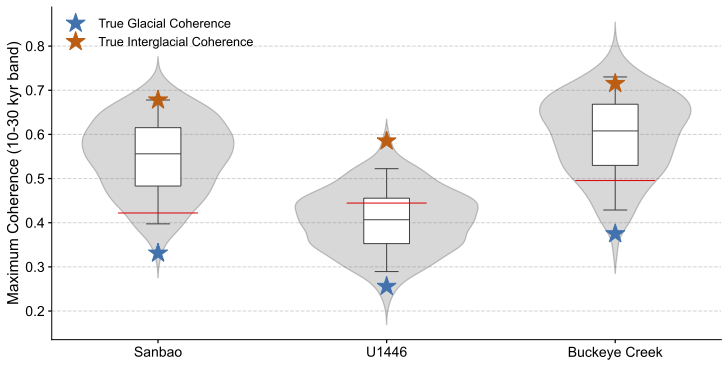
statistics data analysis, numpy matplotlib, Global Coherence Analysis, published
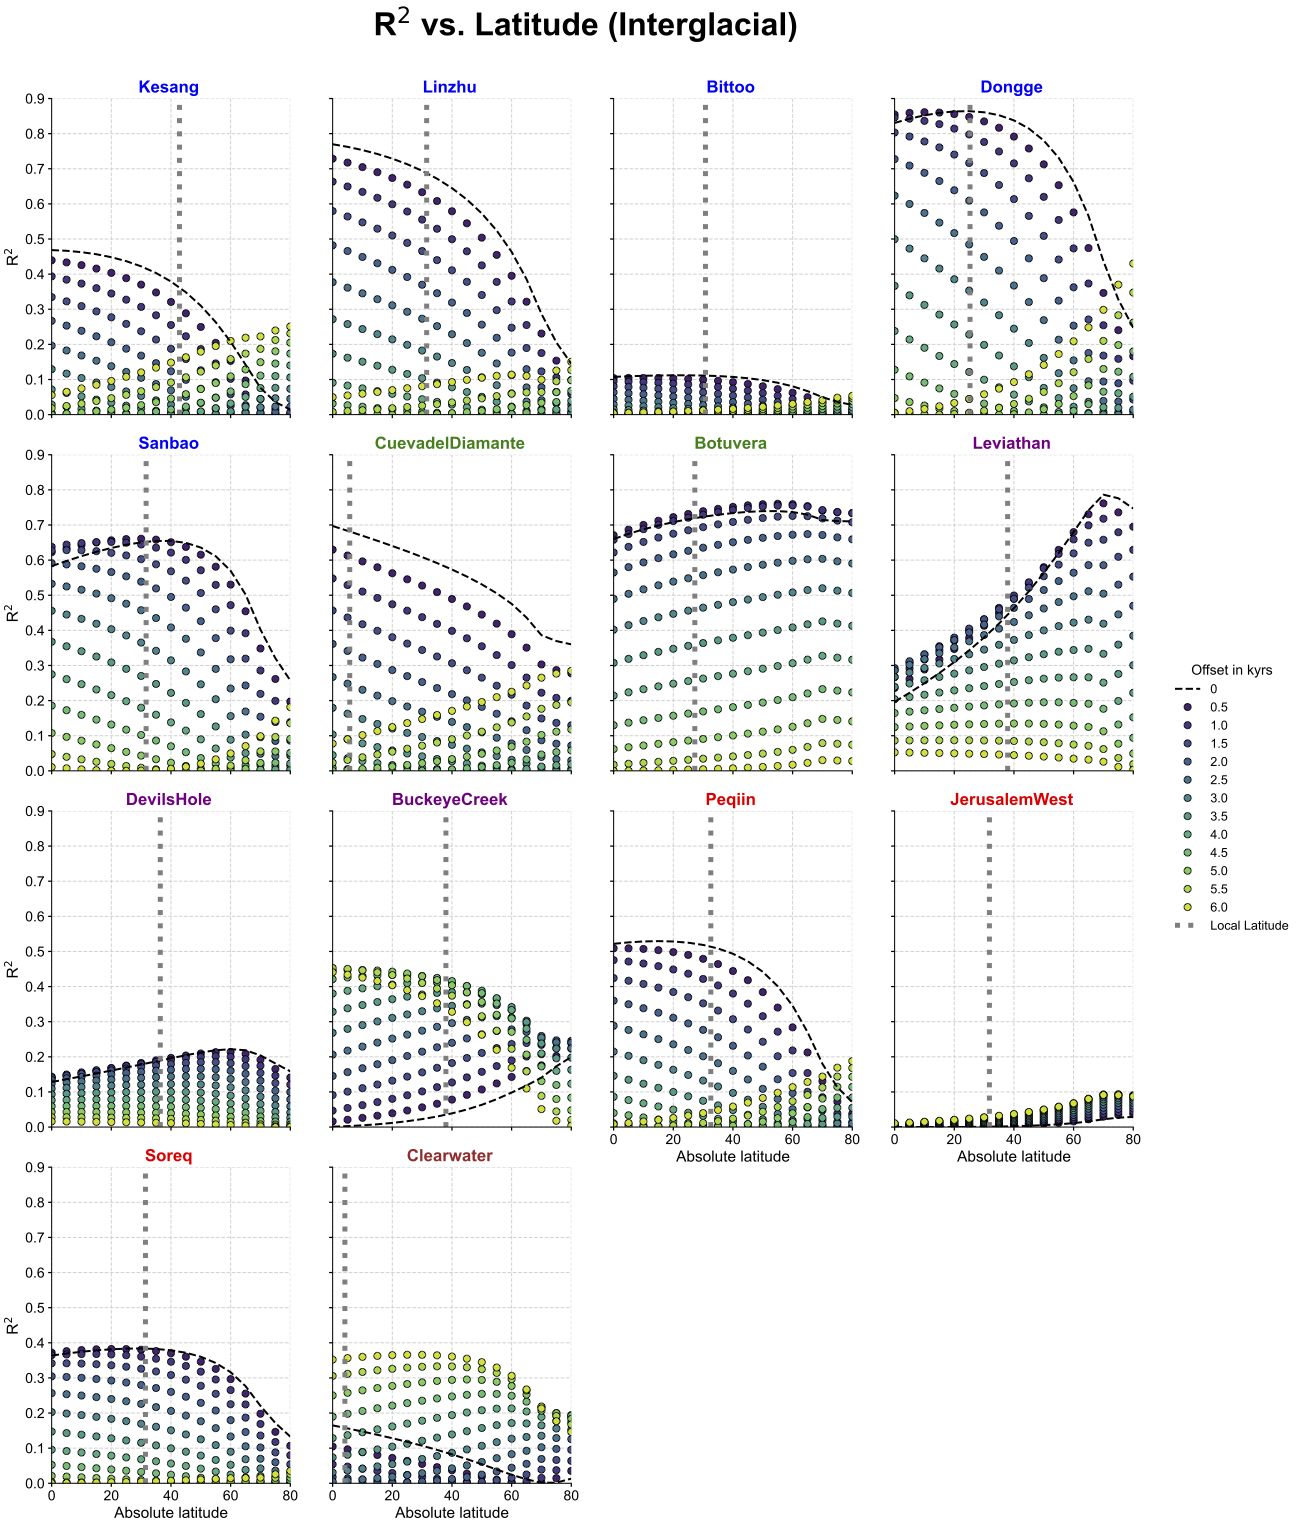
statistics paleoclimate, pyleoclim climlab matplotlib, Correlation Analysis, published
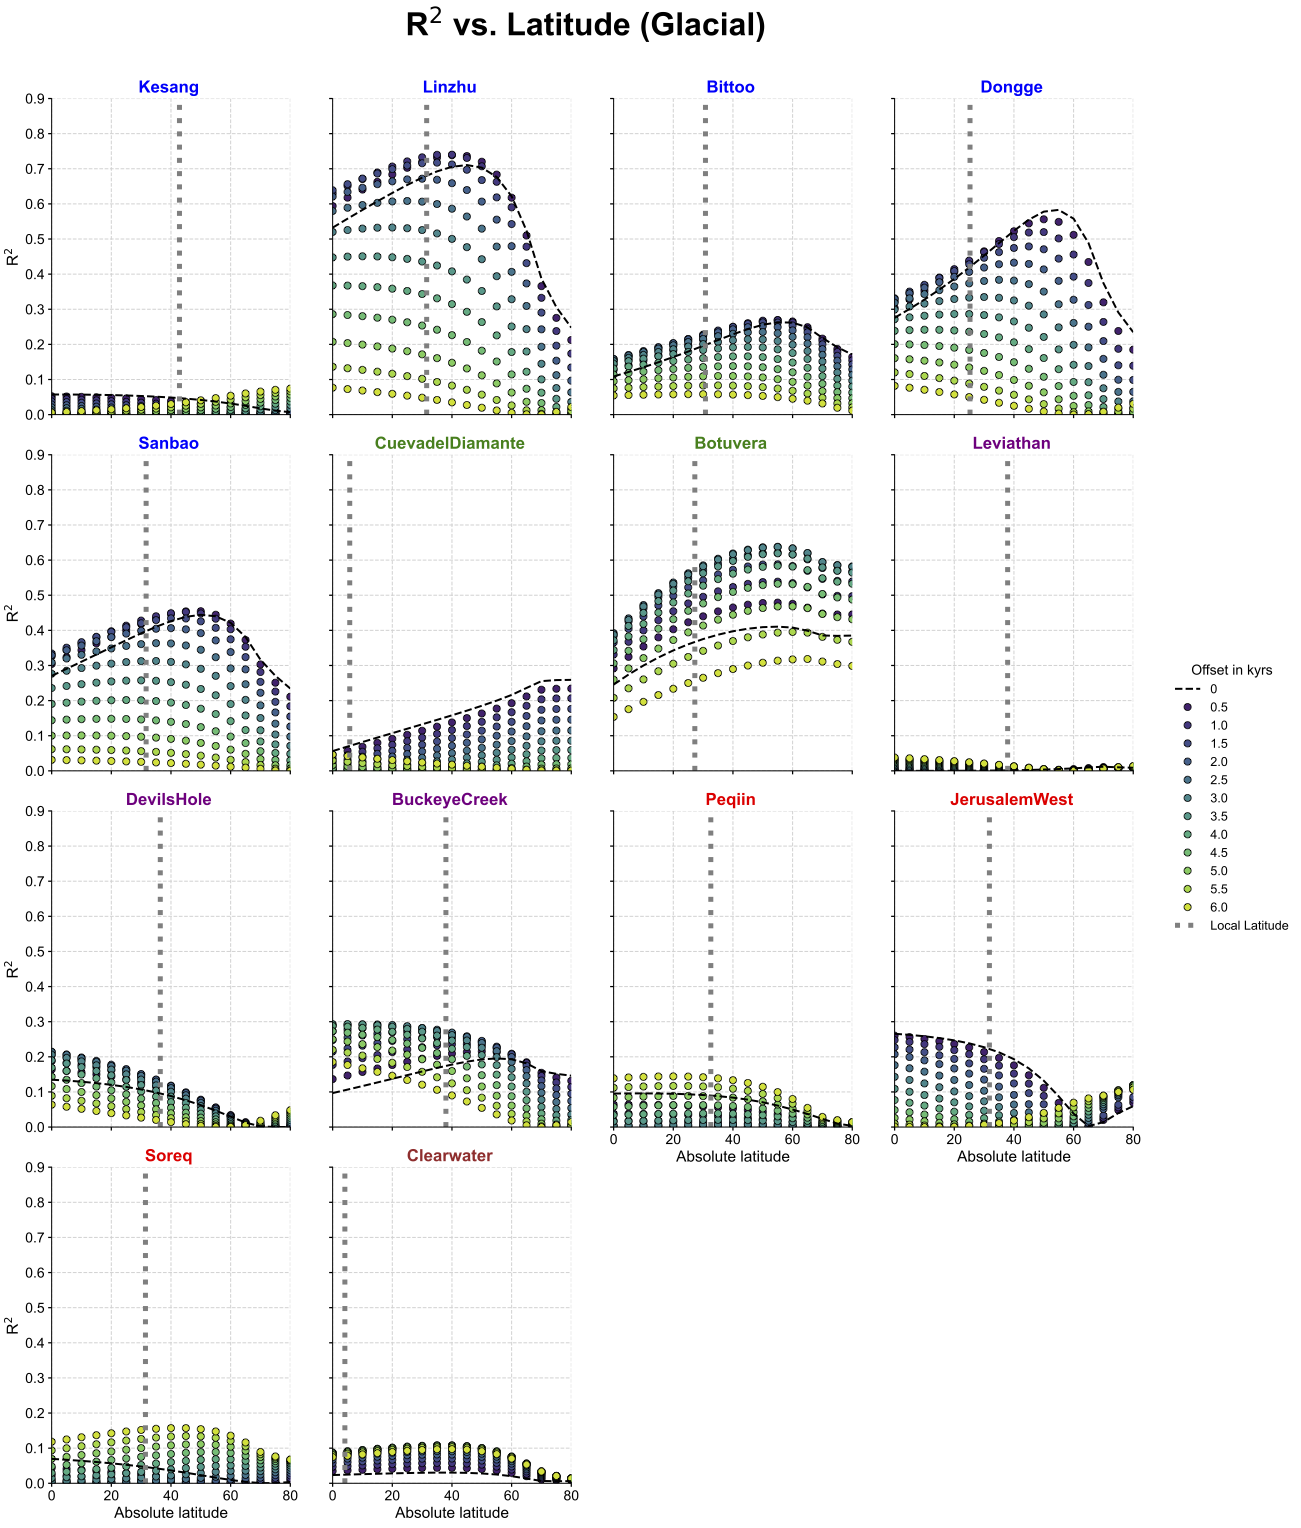
statistics paleoclimate, climlab pyleoclim matplotlib, Correlation Analysis, published

climate sensitivity, statsmodels, EC Calculations, published

data viz, scipy matplotlib, EC Calculations, published

data viz, scipy matplotlib, Main Analysis, published

data viz, scipy matplotlib, Main Analysis, published

data viz, scipy matplotlib, Main Analysis, published

data viz data supplement, pyleoclim matplotlib, Supplement, published

data wrangling, cfr, Data Assembly

data wrangling, cfr, Data Assembly
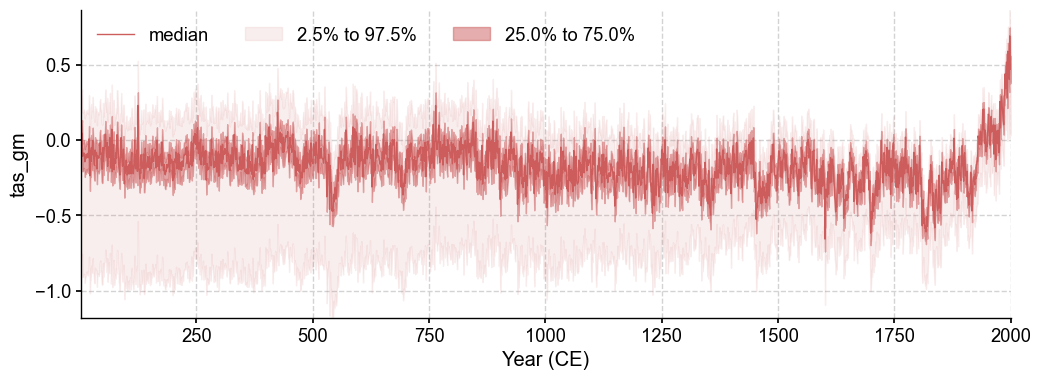
data assimilation data analysis, cfr, Data Assimilation
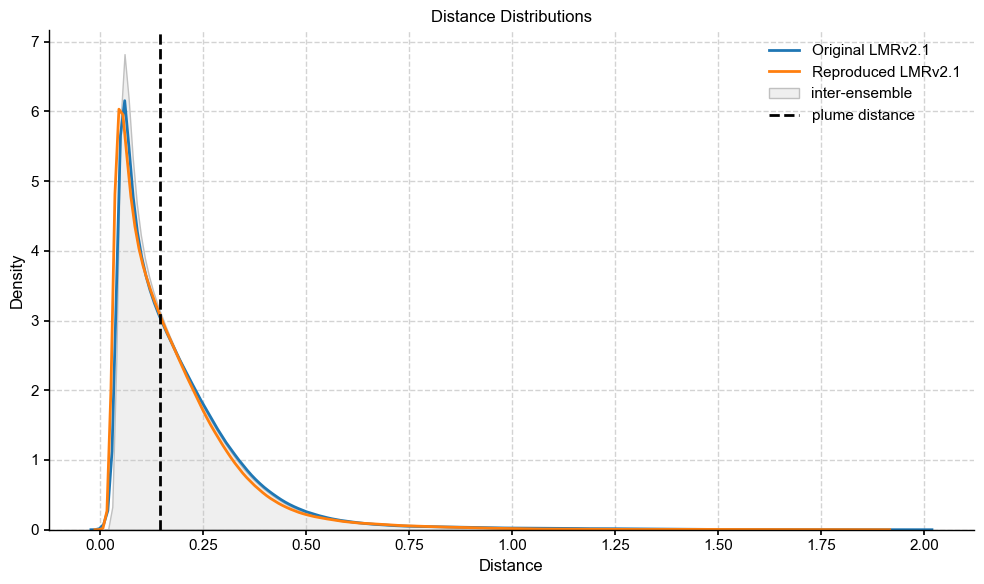
data viz data analysis, cfr xarray matplotlib pens, Validation and Comparison
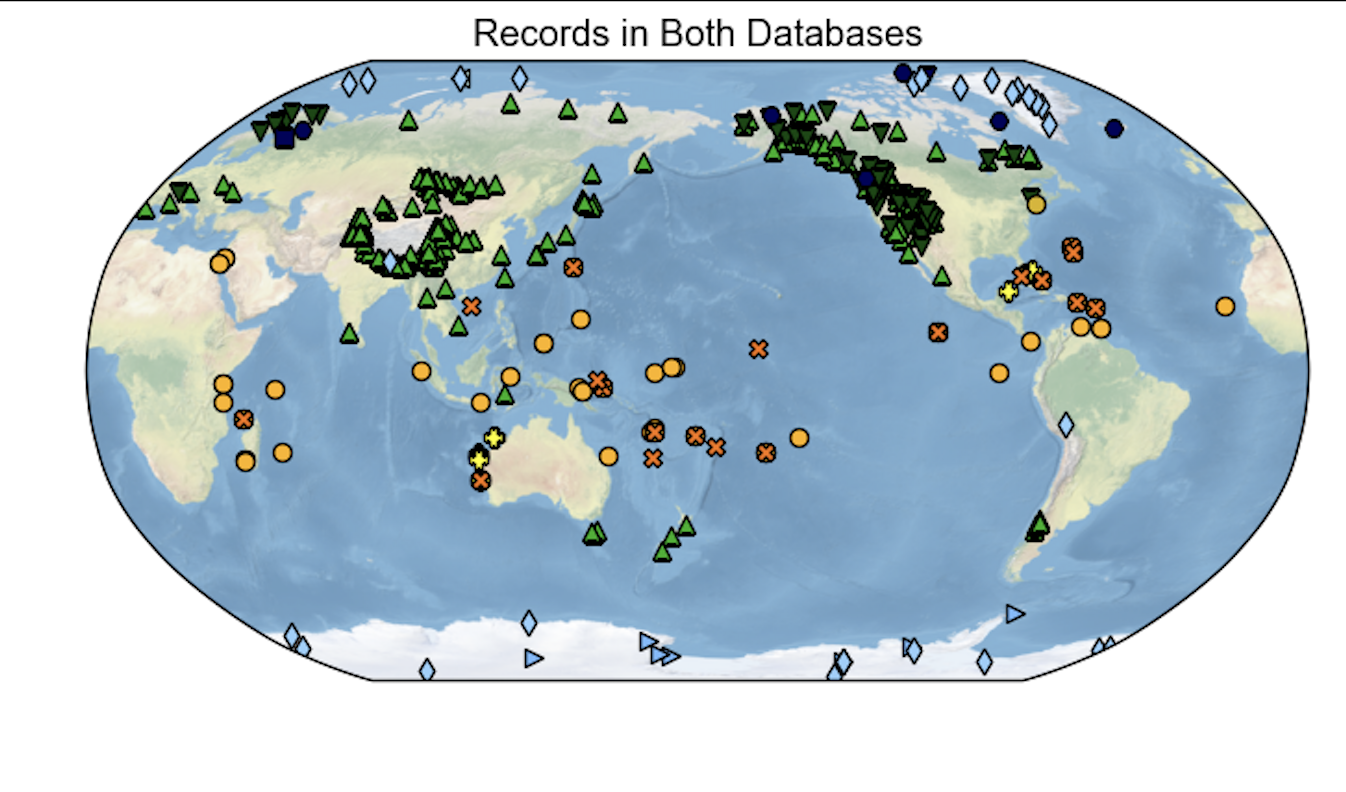
data viz data analysis, cfr matplotlib, Validation and Comparison

data wrangling, cfr pylipd, Data Assembly

data wrangling, cfr pylipd, Data Assembly

data assimilation data analysis, cfr, Data Assimilation
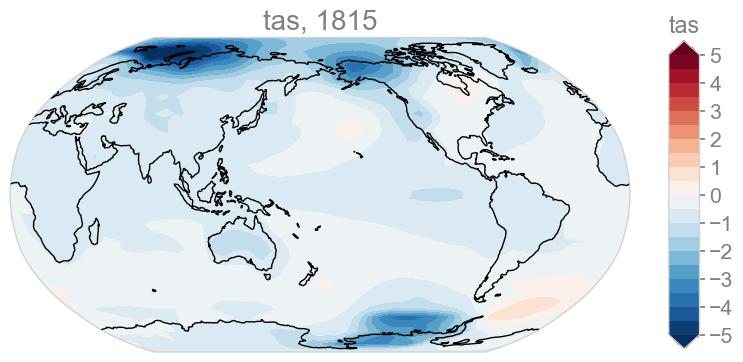
data viz data analysis, cfr matplotlib cartopy pens, Validation and Comparison

data viz data analysis, cfr matplotlib cartopy pens, Validation and Comparison


