Synthetic Data in detectExcursion
makeExcursion.RmdSynthetic excursions
Build a synthetic time series with an excursion
Let’s create a synthetic excursion centered on the 4.2 event
syntheticExcursion <- makeExcursion(time = seq(3000,5000,by = 20), #specify the time
                                     amplitude = 1, #the amplitude of the excursion
                                     delta.amplitude = 0, #the change in amplitude, for asymmetrical excursions
                                     start.time = 4100, #when does the excursion start
                                     duration=200, #how long is the excursion
                                     snr = 1, #the signal to noise ratio
                                    time.variable.name = "Age",
                                    time.units = "yr BP") #signal to noise ratio.
Now, we can use detectExcursion() to test it. We’ll plot
the results after that.
Detect Excursion
In detectExcursion() we need to specify a number of
parameters. Check out the detectExcursion vignette for more details on
how this works.
First, let’s just test the excursion with now uncertainty or null hypothesis testing.
detectedExcusion <- detectExcursion(syntheticExcursion,
                          event.yr = 4200,
                          event.window = rnorm(1000,mean = 400,sd = 100),
                          ref.window = rnorm(1000,mean = 400,sd = 100),
                          sig.num = rnorm(1000,mean = 2,sd = 0.5),
                          exc.type = "either",
                          n.ens = 100,
                          null.hypothesis.n = 100,
                          simulate.time.uncertainty = FALSE,
                          simulate.paleo.uncertainty = FALSE)
## Testing null hypothesis with 100 simulations, each with 100 ensemble members. ■…
## Testing null hypothesis with 100 simulations, each with 100 ensemble members. ■…
## Testing null hypothesis with 100 simulations, each with 100 ensemble members. ■…
## Testing null hypothesis with 100 simulations, each with 100 ensemble members. ■…
## Testing null hypothesis with 100 simulations, each with 100 ensemble members. ■…
## Testing null hypothesis with 100 simulations, each with 100 ensemble members. ■…
## Testing null hypothesis with 100 simulations, each with 100 ensemble members. ■…
## Testing null hypothesis with 100 simulations, each with 100 ensemble members. ■…
## Testing null hypothesis with 100 simulations, each with 100 ensemble members. ■…
## Testing null hypothesis with 100 simulations, each with 100 ensemble members. ■…
## Testing null hypothesis with 100 simulations, each with 100 ensemble members. ■…
## Testing null hypothesis with 100 simulations, each with 100 ensemble members. ■…
## Testing null hypothesis with 100 simulations, each with 100 ensemble members. ■…
## Testing null hypothesis with 100 simulations, each with 100 ensemble members. ■…
## Testing null hypothesis with 100 simulations, each with 100 ensemble members. ■…
## Testing null hypothesis with 100 simulations, each with 100 ensemble members. ■…
## Testing null hypothesis with 100 simulations, each with 100 ensemble members. ■…
## Testing null hypothesis with 100 simulations, each with 100 ensemble members. ■…
## Testing null hypothesis with 100 simulations, each with 100 ensemble members. ■…
## Testing null hypothesis with 100 simulations, each with 100 ensemble members. ■…
## Testing null hypothesis with 100 simulations, each with 100 ensemble members. ■…
## Testing null hypothesis with 100 simulations, each with 100 ensemble members. ■…
## Testing null hypothesis with 100 simulations, each with 100 ensemble members. ■…
## Testing null hypothesis with 100 simulations, each with 100 ensemble members. ■…Now we can use print() and plot to check out the
results
print(detectedExcusion)## Synthetic excursion - Excursion test: Excursion test results
## Searched for positive OR negative excursions in a 403 ± 97 year window around 4200 yr BP, with reference windows of 396 ± 103 years on either side.
##
## Overall result: Empirical p-value = 0.012
## Time uncertainty considered? TRUE
## Paleo uncertainty considered? TRUE
## Parametric uncertainty considered? TRUE: event.window, ref.window, sig.num
## Error propagation ensemble members = 100
## Null hypothesis testing ensemble members = 100
##
## Parameter choices:
## sig.num = 2 ± 0.47
## n.consecutive = 2
## exc.type = either
## min.vals = 8
## na.rm = TRUE
## Let’s plot the results
plotExcursion(detectedExcusion)## Warning: Unknown or uninitialised column: `timeVariableName`.
Excursion testing with uncertainty
Typically, we’ll want to consider uncertainty when detecting excursions. This could be done with age or paleo ensembles included in the data, but for our synthetic experiment, we’ll simulate age and paleo uncertainty.
detectedExcusionEns <- detectExcursion(syntheticExcursion,
                          event.yr = 4200,
                          event.window = 400,
                          ref.window = 400,
                          sig.num = 2,
                          exc.type = "positive",
                          n.ens = 50, #need to test excursions for a number of ensemble member
                          null.hypothesis.n = 50, #how many null hypothesis members to test
                          simulate.time.uncertainty = TRUE,
                          simulate.paleo.uncertainty = TRUE)
## Testing null hypothesis with 50 simulations, each with 50 ensemble members. ■■■…
## Testing null hypothesis with 50 simulations, each with 50 ensemble members. ■■■…
## Testing null hypothesis with 50 simulations, each with 50 ensemble members. ■■■…
## Testing null hypothesis with 50 simulations, each with 50 ensemble members. ■■■…
## Testing null hypothesis with 50 simulations, each with 50 ensemble members. ■■■…
## Testing null hypothesis with 50 simulations, each with 50 ensemble members. ■■■…Now let’s look at the results
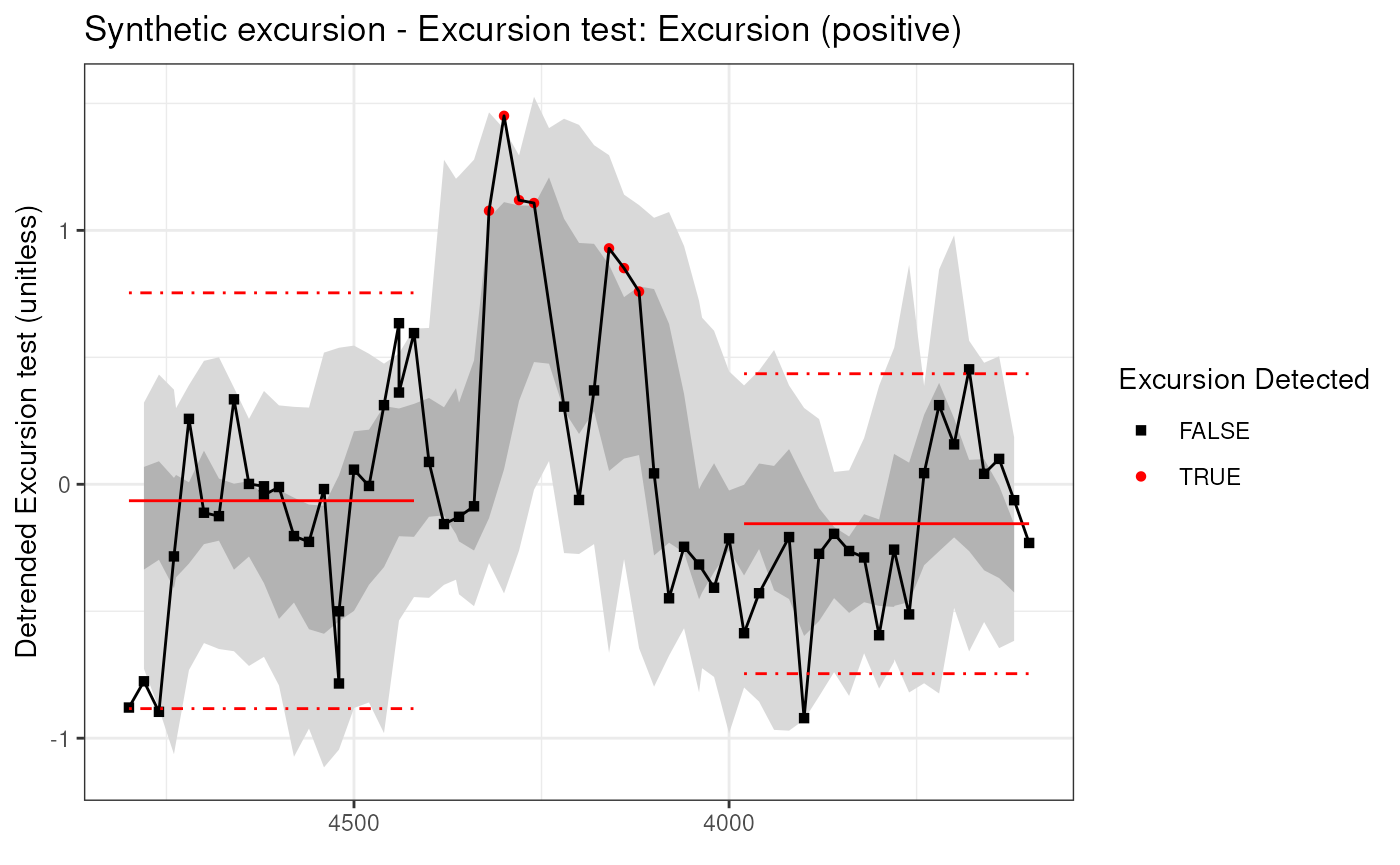
print(detectedExcusionEns)## Synthetic excursion - Excursion test: Excursion test results
## Searched for positive excursions in a 400 year window around 4200 yr BP, with reference windows of 400 years on either side.
##
## Overall result: Empirical p-value = 0
## Time uncertainty considered? TRUE
## Paleo uncertainty considered? TRUE
## Parametric uncertainty considered? FALSE
## Error propagation ensemble members = 50
## Null hypothesis testing ensemble members = 50
##
## Parameter choices:
## sig.num = 2
## n.consecutive = 2
## exc.type = positive
## min.vals = 8
## na.rm = TRUE
## and make a plot
plot(detectedExcusionEns)