[Table 1] Proximity of PMIP3 traces to LMR ensembles#
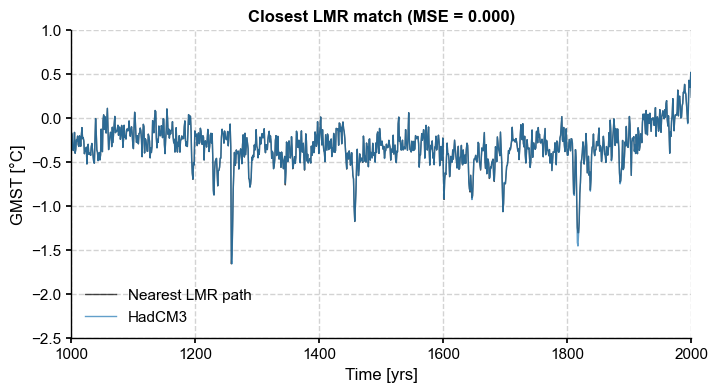
Let’s apply the notion of plume distance to PMIP3 runs and the offline LMR. This reproduces Table 1 from the paper (minus the bolding of compatible values, which was done by hand).
[1]:
import pandas as pd
import pens
import numpy as np
import matplotlib.pyplot as plt
import seaborn as sns
import pyleoclim as pyleo
plt.style.use('default')
pens.set_style()
LMR offline#
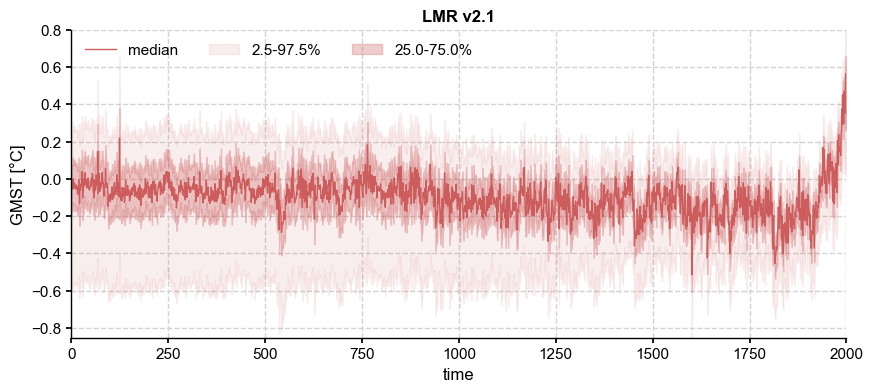
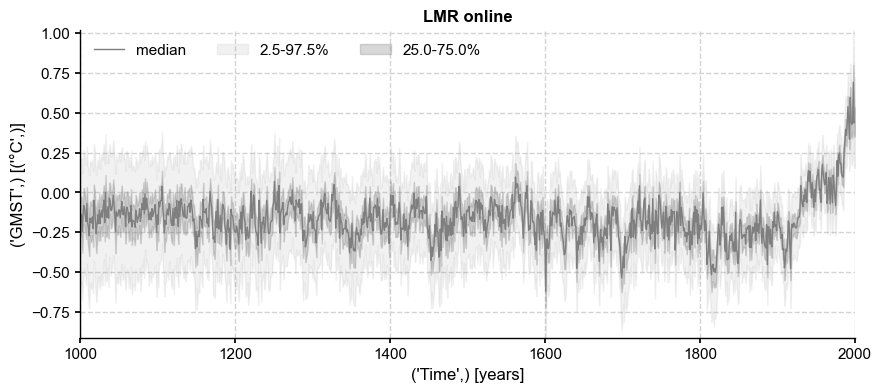
Any probablistic estimate of a time-varying series results in not just one “best” estimate, but a distribution whose characteristics (e.g. location, scale, symmetry) are time-dependent. One example of this is the output of an Ensemble Kalman Filter like the Last Millennium Reanalysis, v2.1. Let us load the data and plot their distribution over time:
[2]:
path = '../data/gmt_MCruns_ensemble_full_LMRv2.1.nc'
ens_off = pens.EnsembleTS().load_nc(path, var='gmt')
ens_off.label = 'LMR v2.1'
ens_off.value_name = 'GMST'
ens_off.value_unit = '\N{DEGREE SIGN}C'
ens_off.plot_qs()
[2]:
(<Figure size 1000x400 with 1 Axes>,
 <Axes: title={'center': 'LMR v2.1'}, xlabel='time', ylabel='GMST [°C]'>)
LMRonline#
[3]:
ens_on = pens.EnsembleTS().load_nc('../data/gmt_MCruns_ensemble_full_LMRonline.nc', var='glob_mean', time_name='year')
ens_on.label = 'LMR online'
ens_on.time_unit = 'years'
ens_on.time_name='Time',            # optional metadata: the name of the time axis
ens_on.value_name='GMST',     # optional metadata: the name of the value axis
ens_on.value_unit='\N{DEGREE SIGN}C',

fig, ax = ens_on.plot_qs(color = 'tab:gray')
Subsample to align to LMR offline
[4]:
ens_o2000 = ens_on.subsample(nsamples=ens_off.nEns)
PMIP3 simulations#
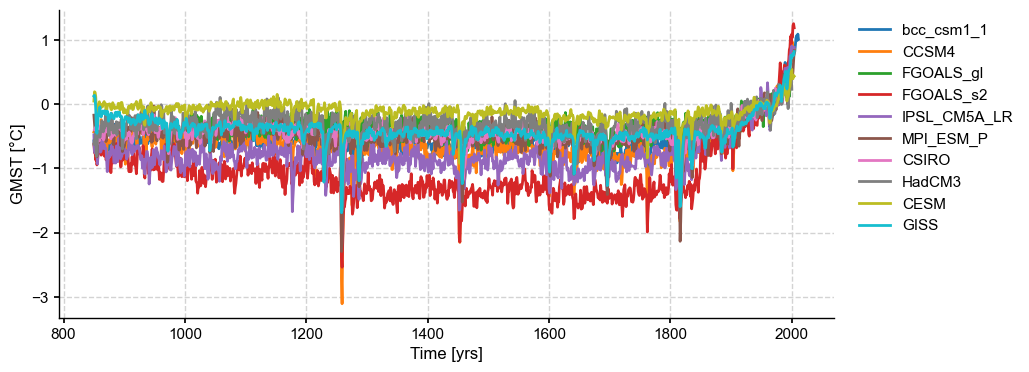
Let us load and plot the data first:
[5]:
df = pd.read_table('../data/PMIP3_GMST.txt')
# create a new pandas.DataFrame to store the processed data
dfn = df.copy()

# remove the data columns for CESM and GISS ensemble members
for i in range(10):
    dfn = dfn.drop([f'CESM_member_{i+1}'], axis=1)

dfn = dfn.drop(['GISS-E2-R_r1i1p127.1'], axis=1)
dfn = dfn.drop(['GISS-E2-R_r1i1p127'], axis=1)
dfn = dfn.drop(['GISS-E2-R_r1i1p121'], axis=1)

# calculate the ensemble mean for CESM and GISS, and add the results into the table
dfn['CESM'] = df[[
    'CESM_member_1',
    'CESM_member_2',
    'CESM_member_3',
    'CESM_member_4',
    'CESM_member_5',
    'CESM_member_6',
    'CESM_member_7',
    'CESM_member_8',
    'CESM_member_9',
    'CESM_member_10',
]].mean(axis=1)

dfn['GISS'] = df[[
    'GISS-E2-R_r1i1p127.1',
    'GISS-E2-R_r1i1p127',
    'GISS-E2-R_r1i1p121',
]].mean(axis=1)

# display the processed data
dfn
[5]:
| Year | bcc_csm1_1 | CCSM4 | FGOALS_gl | FGOALS_s2 | IPSL_CM5A_LR | MPI_ESM_P | CSIRO | HadCM3 | CESM | GISS | |
|---|---|---|---|---|---|---|---|---|---|---|---|
| 0 | 850 | -0.570693 | -0.431830 | NaN | -0.620995 | -0.475963 | -0.170230 | NaN | -0.620517 | 0.049553 | 0.127429 |
| 1 | 851 | -0.698903 | -0.411177 | NaN | -0.753160 | -0.742970 | -0.303124 | -0.398695 | -0.553043 | 0.193858 | 0.138796 |
| 2 | 852 | -0.575440 | -0.404802 | NaN | -0.743508 | -0.758939 | -0.422623 | -0.406343 | -0.560791 | 0.185033 | 0.098170 |
| 3 | 853 | -0.724757 | -0.552719 | NaN | -0.869331 | -0.746460 | -0.335177 | -0.353557 | -0.438949 | 0.120470 | -0.054552 |
| 4 | 854 | -0.724328 | -0.734938 | NaN | -0.826238 | -0.684093 | -0.650792 | -0.416140 | -0.812194 | -0.081349 | -0.407169 |
| ... | ... | ... | ... | ... | ... | ... | ... | ... | ... | ... | ... |
| 1161 | 2011 | 1.013544 | NaN | NaN | NaN | NaN | NaN | NaN | NaN | NaN | NaN |
| 1162 | 2012 | NaN | NaN | NaN | NaN | NaN | NaN | NaN | NaN | NaN | NaN |
| 1163 | 2013 | NaN | NaN | NaN | NaN | NaN | NaN | NaN | NaN | NaN | NaN |
| 1164 | 2014 | NaN | NaN | NaN | NaN | NaN | NaN | NaN | NaN | NaN | NaN |
| 1165 | 2015 | NaN | NaN | NaN | NaN | NaN | NaN | NaN | NaN | NaN | NaN |
1166 rows × 11 columns
[6]:
# store each pyleoclim.Series() object into a dictionary and plot
ts_dict = {}
for name in dfn.columns[1:]:
    ts_dict[name] = pyleo.Series(
        time=dfn['Year'].values,  # the time axis
        value=dfn[name].values,   # the value axis
        label=name,                  # optional metadata: the nickname of the series
        time_name='Time',            # optional metadata: the name of the time axis
        time_unit='yrs',             # optional metadata: the unit of the time axis
        value_name='GMST',     # optional metadata: the name of the value axis
        value_unit='\N{DEGREE SIGN}C',              # optional metadata: the unit of the value axis
        verbose = False,
    )

ts_list = [v for k, v in ts_dict.items()]  # a pythonic way to convert the pyleo.Series items in the dictionary to a list
ms_pmip = pyleo.MultipleSeries(ts_list)
fig, ax = ms_pmip.plot(lgd_kwargs={
        'bbox_to_anchor': (1.25, 1),  # move the legend to the right side
    })
[7]:
common_time = [1000, 2000]
lmr_slice = ens_off.slice(common_time)
HadCM3 = ts_list[7].slice(common_time)
CCSM4 = ts_list[1].slice(common_time)
path_nearest = lmr_slice.sample_nearest(HadCM3.value, metric='MSE')
dist = path_nearest.distance  # extract distance metric
fig, ax = path_nearest.plot(figsize=(8,4),
    title='Closest LMR match (MSE = {:4.3f})'.format(dist),
    color='k', label='Nearest LMR path', alpha=0.7,
)

HadCM3.plot(ax=ax, ylim=(-2.5, 1), alpha=0.7, linewidth=1)
ax.legend(loc='lower left', ncol=1)
ax.set_xlim(common_time)
Resampled trajectories#
For this, we need proper ensemble trajectories, so we resample the LMR offline ensemble in 3 ways: - an autoregressive model (AR(2)) fit to the online LMR ensemble - fractional Gaussian noise (fGn) - power-law behavior
AR model parameters#
The AR(p) model for the mean writes \(X_t = \sum_{\ell=1}^p \phi_\ell X_{t-\ell} + \epsilon_t\), where \(\epsilon\) is Gaussian, i.i.d. with variance \(\sigma^2\) and mean zero, and \(\phi_\ell\) is the autocorrelation at lag \(\ell= 1, \dots, p\). We load the parameters fitted to LMRonline (Perkins & Hakim, 2021) with statsmodel:
[8]:
ar_params = pd.read_csv('../data/LMRonline_ARfit.csv',index_col=0)
ar_params.head()
[8]:
| φ0 | φ1 | φ2 | φ3 | φ4 | var | |
|---|---|---|---|---|---|---|
| ens member | ||||||
| 0 | 0.051950 | 0.459652 | 0.167199 | 0.046081 | 0.073954 | 0.582262 |
| 1 | -0.002925 | 0.337561 | 0.320492 | 0.065557 | 0.094333 | 0.495418 |
| 2 | -0.040660 | 0.610942 | 0.088920 | 0.040907 | 0.061450 | 0.450393 |
| 3 | 0.063021 | 0.365478 | 0.277480 | -0.030457 | 0.066657 | 0.671342 |
| 4 | -0.166564 | 0.269797 | 0.324987 | 0.150546 | -0.015932 | 0.626581 |
[9]:
phi_m = ar_params.mean().to_numpy()[:-3] # take the mean model (dumb, but a start)
paths_ar = lmr_slice.random_paths(model='ar',param=phi_m,p=ens_off.nEns)
beta_o = 0.93
paths_pl = lmr_slice.random_paths(model='power-law',param=beta_o,p=ens_off.nEns)
hurst = (beta_o+1)/2
paths_fGn = lmr_slice.random_paths(model='fGn',param=hurst,p=ens_off.nEns)
100%|██████████| 2000/2000 [00:00<00:00, 15046.88it/s]
100%|██████████| 2000/2000 [00:00<00:00, 2840.15it/s]
100%|██████████| 2000/2000 [00:00<00:00, 10722.20it/s]
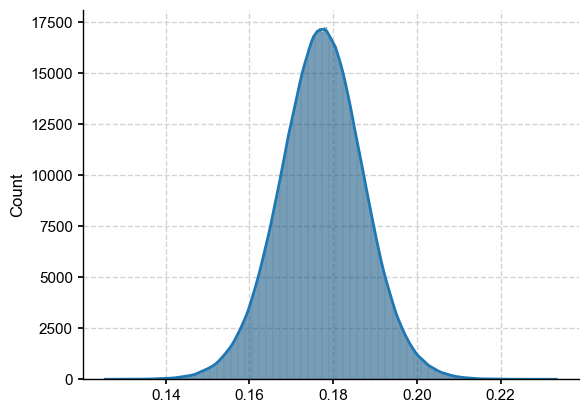
Let’s apply proximity probability to these resampled ensembles
[10]:
dist_pl = paths_pl.distance()
Computing intra-ensemble distance among possible pairs: 100%|██████████| 1999000/1999000 [00:07<00:00, 252116.41it/s]
[11]:
import seaborn as sns
sns.histplot(dist_pl,kde=True)
[11]:
<Axes: ylabel='Count'>
Effects of resampling: the Grand Table#
Benchmarks:#
[12]:
N = ens_off.nEns
npairs = int(N*(N-1)/2)
intra_ens_dist = np.empty((4,npairs))
intra_ens_dist[0,:] = ens_o2000.distance()
intra_ens_dist[1,:] = paths_ar.distance()
intra_ens_dist[2,:] = paths_fGn.distance()
intra_ens_dist[3,:] = paths_pl.distance()
Computing intra-ensemble distance among possible pairs: 100%|██████████| 1999000/1999000 [00:05<00:00, 371520.73it/s]
Computing intra-ensemble distance among possible pairs: 100%|██████████| 1999000/1999000 [00:08<00:00, 241574.97it/s]
Computing intra-ensemble distance among possible pairs: 100%|██████████| 1999000/1999000 [00:08<00:00, 245245.44it/s]
Computing intra-ensemble distance among possible pairs: 100%|██████████| 1999000/1999000 [00:08<00:00, 243173.15it/s]
[13]:
#qs = [0.9, 0.95, 0.99]
q95 = np.empty((4,1))
for i in range(4):
    q95[i,:] = np.quantile(intra_ens_dist[i,:],0.95)
    #print(f'{q95[i,:]:.2f}')
[14]:
print(q95)
[[0.25746134]
 [0.18425562]
 [0.19637196]
 [0.19365803]]
Plume Distances#
PUT INTO ND array!
[15]:
common = [1000, 1998] # FGOALS is ruining it for everyone else.
ensembles = ['ens_on','paths_ar','paths_fGn','paths_pl']
pmip3_plume_dist = np.empty((4,2,len(ts_list)))
for i, ts in enumerate(ms_pmip.series_list):
    ts_lm = ts.slice(common)
    for k, ens in enumerate(ensembles):
        delta_eps50_m, delta_eps50_hdi = eval(ens).slice(common).plume_distance(y=ts_lm.value, spread_stat='HDI')
        print(f"HDI for {ens},{ts_lm.label} is {delta_eps50_hdi}")
        pmip3_plume_dist[k,0,i] = delta_eps50_m
        pmip3_plume_dist[k,1,i] = (delta_eps50_hdi[0] <= q95[k])
HDI for ens_on,bcc_csm1_1 is [0.3169023  0.48872373]
HDI for paths_ar,bcc_csm1_1 is [0.41504097 0.42824128]
HDI for paths_fGn,bcc_csm1_1 is [0.40244935 0.44500142]
HDI for paths_pl,bcc_csm1_1 is [0.40561431 0.43801948]
HDI for ens_on,CCSM4 is [0.3916529  0.56654911]
HDI for paths_ar,CCSM4 is [0.49767313 0.51008715]
HDI for paths_fGn,CCSM4 is [0.48579573 0.5254638 ]
HDI for paths_pl,CCSM4 is [0.48817625 0.51794544]
HDI for ens_on,FGOALS_gl is [0.17160513 0.29553263]
HDI for paths_ar,FGOALS_gl is [0.24135012 0.25423495]
HDI for paths_fGn,FGOALS_gl is [0.23434179 0.26404927]
HDI for paths_pl,FGOALS_gl is [0.23443021 0.2604615 ]
HDI for ens_on,FGOALS_s2 is [0.87291123 1.06121614]
HDI for paths_ar,FGOALS_s2 is [0.98373063 0.99706907]
HDI for paths_fGn,FGOALS_s2 is [0.97022154 1.0121546 ]
HDI for paths_pl,FGOALS_s2 is [0.97599772 1.00668997]
HDI for ens_on,IPSL_CM5A_LR is [0.53575133 0.71567922]
HDI for paths_ar,IPSL_CM5A_LR is [0.64020395 0.65360194]
HDI for paths_fGn,IPSL_CM5A_LR is [0.62554657 0.67010464]
HDI for paths_pl,IPSL_CM5A_LR is [0.62944168 0.6622128 ]
HDI for ens_on,MPI_ESM_P is [0.26036808 0.42085223]
HDI for paths_ar,MPI_ESM_P is [0.35523594 0.3677807 ]
HDI for paths_fGn,MPI_ESM_P is [0.34560199 0.38069716]
HDI for paths_pl,MPI_ESM_P is [0.34754917 0.37588254]
HDI for ens_on,CSIRO is [0.20843753 0.36095076]
HDI for paths_ar,CSIRO is [0.29821175 0.31114956]
HDI for paths_fGn,CSIRO is [0.2886882  0.32264604]
HDI for paths_pl,CSIRO is [0.28954273 0.31785737]
HDI for ens_on,HadCM3 is [0.16782503 0.27798754]
HDI for paths_ar,HadCM3 is [0.22615674 0.24131117]
HDI for paths_fGn,HadCM3 is [0.21807057 0.24960349]
HDI for paths_pl,HadCM3 is [0.21830547 0.24968002]
HDI for ens_on,CESM is [0.10192542 0.2290239 ]
HDI for paths_ar,CESM is [0.15195883 0.16841925]
HDI for paths_fGn,CESM is [0.13851015 0.17773333]
HDI for paths_pl,CESM is [0.1437939 0.1771722]
HDI for ens_on,GISS is [0.20433883 0.36590171]
HDI for paths_ar,GISS is [0.3001031 0.3123527]
HDI for paths_fGn,GISS is [0.29006052 0.32279645]
HDI for paths_pl,GISS is [0.29242003 0.31987262]
[16]:
pmip3_plume_dist
[16]:
array([[[0.41122165, 0.49245583, 0.23326212, 0.97809225, 0.63587909,
         0.34895453, 0.29070405, 0.21652265, 0.14846731, 0.29227668],
        [0.        , 0.        , 1.        , 0.        , 0.        ,
         0.        , 1.        , 1.        , 1.        , 1.        ]],

       [[0.42169219, 0.50386857, 0.24783376, 0.99042062, 0.64709307,
         0.36145699, 0.30416287, 0.23330397, 0.15965498, 0.30616651],
        [0.        , 0.        , 0.        , 0.        , 0.        ,
         0.        , 0.        , 0.        , 1.        , 0.        ]],

       [[0.42106854, 0.50327215, 0.2481492 , 0.98983175, 0.64638777,
         0.36123697, 0.30418705, 0.23342851, 0.15971432, 0.30591557],
        [0.        , 0.        , 0.        , 0.        , 0.        ,
         0.        , 0.        , 0.        , 1.        , 0.        ]],

       [[0.42126125, 0.50330476, 0.24823178, 0.99004559, 0.64653163,
         0.36133402, 0.30419209, 0.233086  , 0.15993087, 0.3058728 ],
        [0.        , 0.        , 0.        , 0.        , 0.        ,
         0.        , 0.        , 0.        , 1.        , 0.        ]]])
Export to LaTeX. First, define multilevel index:
[17]:
arrays = [['LMRon', 'LMRon', 'LMRoff, AR(2)','LMRoff, AR(2)', 'LMRoff, fGn', 'LMRoff, fGn', 'LMRoff, $f^{-\beta}$','LMRoff, $f^{-\beta}$'],
          ['med','bool','med','bool','med','bool','med','bool','med','bool']]
tuples = list(zip(*arrays))
index = pd.MultiIndex.from_tuples(tuples, names=["ensemble", "statistic"])
index
[17]:
MultiIndex([(              'LMRon',  'med'),
            (              'LMRon', 'bool'),
            (      'LMRoff, AR(2)',  'med'),
            (      'LMRoff, AR(2)', 'bool'),
            (        'LMRoff, fGn',  'med'),
            (        'LMRoff, fGn', 'bool'),
            ('LMRoff, $f^{-eta}$',  'med'),
            ('LMRoff, $f^{-eta}$', 'bool')],
           names=['ensemble', 'statistic'])
[18]:
pmip3_plume2d = pmip3_plume_dist.reshape([4*2, len(ts_list)])
df = pd.DataFrame(pmip3_plume2d,
                  index = index,
                  columns= dfn.columns[1:])
df.head()
[18]:
| bcc_csm1_1 | CCSM4 | FGOALS_gl | FGOALS_s2 | IPSL_CM5A_LR | MPI_ESM_P | CSIRO | HadCM3 | CESM | GISS | ||
|---|---|---|---|---|---|---|---|---|---|---|---|
| ensemble | statistic | ||||||||||
| LMRon | med | 0.411222 | 0.492456 | 0.233262 | 0.978092 | 0.635879 | 0.348955 | 0.290704 | 0.216523 | 0.148467 | 0.292277 |
| bool | 0.000000 | 0.000000 | 1.000000 | 0.000000 | 0.000000 | 0.000000 | 1.000000 | 1.000000 | 1.000000 | 1.000000 | |
| LMRoff, AR(2) | med | 0.421692 | 0.503869 | 0.247834 | 0.990421 | 0.647093 | 0.361457 | 0.304163 | 0.233304 | 0.159655 | 0.306167 |
| bool | 0.000000 | 0.000000 | 0.000000 | 0.000000 | 0.000000 | 0.000000 | 0.000000 | 0.000000 | 1.000000 | 0.000000 | |
| LMRoff, fGn | med | 0.421069 | 0.503272 | 0.248149 | 0.989832 | 0.646388 | 0.361237 | 0.304187 | 0.233429 | 0.159714 | 0.305916 |
[19]:
# add benchmarks
thresh = np.zeros((8))
thresh[::2] = np.squeeze(q95[:])
df.insert(0,"$q_{95}",thresh)
#
print(df.to_latex(formatters={"name": str.upper}, float_format="%.2f"))
\begin{tabular}{llrrrrrrrrrrr}
\toprule
 &  & $q_{95} & bcc_csm1_1 & CCSM4 & FGOALS_gl & FGOALS_s2 & IPSL_CM5A_LR & MPI_ESM_P & CSIRO & HadCM3 & CESM & GISS \\
ensemble & statistic &  &  &  &  &  &  &  &  &  &  &  \\
\midrule
\multirow[t]{2}{*}{LMRon} & med & 0.26 & 0.41 & 0.49 & 0.23 & 0.98 & 0.64 & 0.35 & 0.29 & 0.22 & 0.15 & 0.29 \\
 & bool & 0.00 & 0.00 & 0.00 & 1.00 & 0.00 & 0.00 & 0.00 & 1.00 & 1.00 & 1.00 & 1.00 \\
\cline{1-13}
\multirow[t]{2}{*}{LMRoff, AR(2)} & med & 0.18 & 0.42 & 0.50 & 0.25 & 0.99 & 0.65 & 0.36 & 0.30 & 0.23 & 0.16 & 0.31 \\
 & bool & 0.00 & 0.00 & 0.00 & 0.00 & 0.00 & 0.00 & 0.00 & 0.00 & 0.00 & 1.00 & 0.00 \\
\cline{1-13}
\multirow[t]{2}{*}{LMRoff, fGn} & med & 0.20 & 0.42 & 0.50 & 0.25 & 0.99 & 0.65 & 0.36 & 0.30 & 0.23 & 0.16 & 0.31 \\
 & bool & 0.00 & 0.00 & 0.00 & 0.00 & 0.00 & 0.00 & 0.00 & 0.00 & 0.00 & 1.00 & 0.00 \\
\cline{1-13}
\multirow[t]{2}{*}{LMRoff, $f^{eta}$} & med & 0.19 & 0.42 & 0.50 & 0.25 & 0.99 & 0.65 & 0.36 & 0.30 & 0.23 & 0.16 & 0.31 \\
 & bool & 0.00 & 0.00 & 0.00 & 0.00 & 0.00 & 0.00 & 0.00 & 0.00 & 0.00 & 1.00 & 0.00 \\
\cline{1-13}
\bottomrule
\end{tabular}