import numpy as np
import pandas as pd
import ammonyte as amt
from ammonyte.core.series import Series
from ammonyte.utils.ks import KS_testDetecting Tipping Points with Ammonyte’s Augmented KS Test
Import Required Libraries
Load the NGRIP Dataset
The NGRIP (North Greenland Ice Core Project) dataset contains high-resolution \(\delta^{18}O\) isotope measurements spanning the last glacial period. It is used here to demonstrate detection of abrupt climate transitions.
# Load NGRIP dataset using the proper ammonyte data path
ngrip = amt.Series.from_csv('../ammonyte/data/NGRIP.csv')

# Display basic metadata about the dataset
print(f"Loaded NGRIP dataset: {ngrip.label}")
print(f"Time range: {ngrip.time.min():.2f} - {ngrip.time.max():.2f} {ngrip.time_unit}")
print(f"Number of data points: {len(ngrip.time)}")
print(f"Value range: {ngrip.value.min():.2f} - {ngrip.value.max():.2f} {ngrip.value_unit}")

# Show the object
ngrip
Time axis values sorted in ascending order
Time axis values sorted in ascending order
Loaded NGRIP dataset: NGRIP Ice Core Data
Time range: 0.05 - 122.27 kyr b2k
Number of data points: 6112
Value range: -46.50 - -32.11 ‰
{'label': 'NGRIP Ice Core Data'}None
Age [kyr b2k]
0.05 -35.11
0.07 -34.65
0.09 -34.53
0.11 -35.29
0.13 -35.02
...
122.19 -32.85
122.21 -32.66
122.23 -32.66
122.25 -32.51
122.27 -32.56
Name: δ¹⁸O [‰], Length: 6112, dtype: float64Dataset Metadata
print("=== NGRIP DATASET INFO ===")
print(f"Original NGRIP series label: {ngrip.label}")
print(f"Value name: {ngrip.value_name}")
print(f"Value unit: {ngrip.value_unit}")
print(f"Time name: {ngrip.time_name}")
print(f"Time unit: {ngrip.time_unit}")
=== NGRIP DATASET INFO ===
Original NGRIP series label: NGRIP Ice Core Data
Value name: δ¹⁸O
Value unit: ‰
Time name: Age
Time unit: kyr b2kNGRIP \(\delta^{18}O\) Record
More negative values indicate colder conditions.
# The NGRIP series is already loaded with proper metadata
#plot the time series to visualize the data
fig, ax = ngrip.plot(figsize=(15, 6))
ax.set_title('NGRIP Ice Core $\delta^{18}O\ [\%]$ Record')
ax.grid(True, alpha=0.3)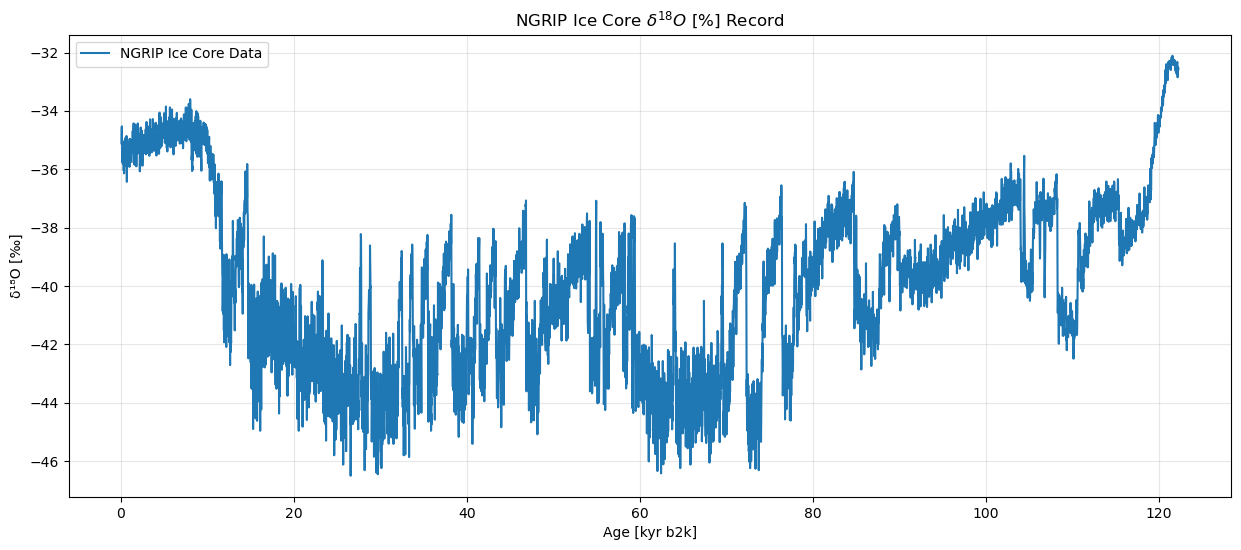
Step 1: Apply KS Test
The augmented KS test scans the time series with sliding windows of varying sizes, comparing statistical distributions on either side of each candidate transition point.
Parameters (from Bagniewski et al. 2021, optimized for NGRIP): - w_min = 0.12, w_max = 2.5: window size range (kyr) - n_w = 15: number of logarithmically-spaced window sizes - d_c = 0.77: KS statistic threshold - n_c = 3: minimum samples per window half - s_c = 2: standard deviation ratio cutoff - x_c = 0.8: minimum proxy value change (‰)
# Apply KS test — parameters from Bagniewski et al. (2021)
transitions = ngrip.kstest(w_min=0.12, w_max=2.5, n_w=15, d_c=0.77, n_c=3, s_c=2, x_c=0.8)
print(transitions)
Deterministic Transition Detection Results - NGRIP Ice Core Data
================================================================
+----------+---------------------+----------------+------------------+---------------------+
| Method | Total Transitions | Upward Jumps | Downward Jumps | Series Label |
+==========+=====================+================+==================+=====================+
| KS test | 104 | 49 | 55 | NGRIP Ice Core Data |
+----------+---------------------+----------------+------------------+---------------------+
Transition Details:
1. Time: 8.14 kyr b2k, Direction: Upward, d_statistics: 0.4080, p_values: < 1e-8
2. Time: 8.30 kyr b2k, Direction: Downward, d_statistics: 0.3760, p_values: < 1e-7
3. Time: 10.20 kyr b2k, Direction: Upward, d_statistics: 0.9203, p_values: < 1e-56
4. Time: 10.86 kyr b2k, Direction: Upward, d_statistics: 0.9680, p_values: < 1e-65
5. Time: 11.52 kyr b2k, Direction: Downward, d_statistics: 0.9040, p_values: < 1e-53
6. Time: 11.68 kyr b2k, Direction: Upward, d_statistics: 0.9520, p_values: < 1e-62
7. Time: 12.78 kyr b2k, Direction: Downward, d_statistics: 0.3520, p_values: < 1e-6
8. Time: 13.26 kyr b2k, Direction: Downward, d_statistics: 0.2160, p_values: < 1e-2
9. Time: 13.56 kyr b2k, Direction: Upward, d_statistics: 0.2640, p_values: < 1e-3
10. Time: 13.96 kyr b2k, Direction: Upward, d_statistics: 0.3760, p_values: < 1e-7
11. Time: 14.18 kyr b2k, Direction: Downward, d_statistics: 0.4240, p_values: < 1e-9
12. Time: 14.68 kyr b2k, Direction: Upward, d_statistics: 0.6160, p_values: < 1e-21
13. Time: 19.94 kyr b2k, Direction: Upward, d_statistics: 0.4320, p_values: < 1e-10
14. Time: 21.88 kyr b2k, Direction: Downward, d_statistics: 0.1600, p_values: 0.08
15. Time: 23.36 kyr b2k, Direction: Upward, d_statistics: 0.4800, p_values: < 1e-12
16. Time: 24.92 kyr b2k, Direction: Downward, d_statistics: 0.2640, p_values: < 1e-3
17. Time: 27.50 kyr b2k, Direction: Downward, d_statistics: 0.2000, p_values: 0.01
18. Time: 27.78 kyr b2k, Direction: Upward, d_statistics: 0.2880, p_values: < 1e-4
19. Time: 28.60 kyr b2k, Direction: Downward, d_statistics: 0.2320, p_values: < 1e-2
20. Time: 28.90 kyr b2k, Direction: Upward, d_statistics: 0.3120, p_values: < 1e-5
21. Time: 32.04 kyr b2k, Direction: Downward, d_statistics: 0.4640, p_values: < 1e-11
22. Time: 32.52 kyr b2k, Direction: Upward, d_statistics: 0.2596, p_values: < 1e-3
23. Time: 33.36 kyr b2k, Direction: Downward, d_statistics: 0.4880, p_values: < 1e-13
24. Time: 33.74 kyr b2k, Direction: Upward, d_statistics: 0.3157, p_values: < 1e-5
25. Time: 34.74 kyr b2k, Direction: Downward, d_statistics: 0.3520, p_values: < 1e-6
26. Time: 35.02 kyr b2k, Direction: Downward, d_statistics: 0.3440, p_values: < 1e-6
27. Time: 35.48 kyr b2k, Direction: Upward, d_statistics: 0.1520, p_values: 0.11
28. Time: 35.76 kyr b2k, Direction: Upward, d_statistics: 0.2080, p_values: < 1e-2
29. Time: 35.94 kyr b2k, Direction: Downward, d_statistics: 0.2320, p_values: < 1e-2
30. Time: 37.06 kyr b2k, Direction: Downward, d_statistics: 0.2320, p_values: < 1e-2
31. Time: 38.22 kyr b2k, Direction: Upward, d_statistics: 0.5600, p_values: < 1e-17
32. Time: 39.90 kyr b2k, Direction: Downward, d_statistics: 0.2240, p_values: < 1e-2
33. Time: 40.16 kyr b2k, Direction: Upward, d_statistics: 0.2160, p_values: < 1e-2
34. Time: 40.96 kyr b2k, Direction: Downward, d_statistics: 0.5440, p_values: < 1e-16
35. Time: 41.46 kyr b2k, Direction: Upward, d_statistics: 0.2160, p_values: < 1e-2
36. Time: 42.28 kyr b2k, Direction: Downward, d_statistics: 0.2960, p_values: < 1e-4
37. Time: 43.36 kyr b2k, Direction: Upward, d_statistics: 0.2160, p_values: < 1e-2
38. Time: 43.66 kyr b2k, Direction: Downward, d_statistics: 0.1440, p_values: 0.15
39. Time: 44.36 kyr b2k, Direction: Downward, d_statistics: 0.4880, p_values: < 1e-13
40. Time: 44.56 kyr b2k, Direction: Upward, d_statistics: 0.3440, p_values: < 1e-6
41. Time: 46.84 kyr b2k, Direction: Upward, d_statistics: 0.5840, p_values: < 1e-19
42. Time: 48.46 kyr b2k, Direction: Downward, d_statistics: 0.4720, p_values: < 1e-12
43. Time: 48.84 kyr b2k, Direction: Downward, d_statistics: 0.5200, p_values: < 1e-15
44. Time: 49.14 kyr b2k, Direction: Downward, d_statistics: 0.5360, p_values: < 1e-16
45. Time: 49.28 kyr b2k, Direction: Upward, d_statistics: 0.5360, p_values: < 1e-16
46. Time: 49.58 kyr b2k, Direction: Downward, d_statistics: 0.6240, p_values: < 1e-22
47. Time: 51.64 kyr b2k, Direction: Downward, d_statistics: 0.7520, p_values: < 1e-34
48. Time: 54.22 kyr b2k, Direction: Upward, d_statistics: 0.7680, p_values: < 1e-35
49. Time: 55.00 kyr b2k, Direction: Upward, d_statistics: 0.4560, p_values: < 1e-11
50. Time: 55.42 kyr b2k, Direction: Downward, d_statistics: 0.2320, p_values: < 1e-2
51. Time: 55.78 kyr b2k, Direction: Upward, d_statistics: 0.2160, p_values: < 1e-2
52. Time: 56.58 kyr b2k, Direction: Downward, d_statistics: 0.5120, p_values: < 1e-14
53. Time: 58.04 kyr b2k, Direction: Upward, d_statistics: 0.4240, p_values: < 1e-9
54. Time: 58.16 kyr b2k, Direction: Downward, d_statistics: 0.4080, p_values: < 1e-8
55. Time: 58.62 kyr b2k, Direction: Downward, d_statistics: 0.5280, p_values: < 1e-15
56. Time: 58.90 kyr b2k, Direction: Downward, d_statistics: 0.6960, p_values: < 1e-28
57. Time: 59.08 kyr b2k, Direction: Upward, d_statistics: 0.7840, p_values: < 1e-37
58. Time: 59.30 kyr b2k, Direction: Downward, d_statistics: 0.7200, p_values: < 1e-30
59. Time: 59.44 kyr b2k, Direction: Upward, d_statistics: 0.7760, p_values: < 1e-36
60. Time: 61.62 kyr b2k, Direction: Downward, d_statistics: 0.2480, p_values: < 1e-3
61. Time: 63.86 kyr b2k, Direction: Downward, d_statistics: 0.1680, p_values: 0.06
62. Time: 64.14 kyr b2k, Direction: Upward, d_statistics: 0.1292, p_values: 0.23
63. Time: 66.96 kyr b2k, Direction: Upward, d_statistics: 0.1200, p_values: 0.33
64. Time: 67.26 kyr b2k, Direction: Downward, d_statistics: 0.1600, p_values: 0.08
65. Time: 68.56 kyr b2k, Direction: Downward, d_statistics: 0.2960, p_values: < 1e-4
66. Time: 69.36 kyr b2k, Direction: Downward, d_statistics: 0.5920, p_values: < 1e-19
67. Time: 69.64 kyr b2k, Direction: Upward, d_statistics: 0.5440, p_values: < 1e-16
68. Time: 70.38 kyr b2k, Direction: Downward, d_statistics: 0.6240, p_values: < 1e-22
69. Time: 70.84 kyr b2k, Direction: Downward, d_statistics: 0.5040, p_values: < 1e-14
70. Time: 72.34 kyr b2k, Direction: Upward, d_statistics: 0.5200, p_values: < 1e-15
71. Time: 74.18 kyr b2k, Direction: Downward, d_statistics: 0.6960, p_values: < 1e-28
72. Time: 76.44 kyr b2k, Direction: Upward, d_statistics: 0.5520, p_values: < 1e-17
73. Time: 77.76 kyr b2k, Direction: Downward, d_statistics: 0.5040, p_values: < 1e-14
74. Time: 78.14 kyr b2k, Direction: Upward, d_statistics: 0.5200, p_values: < 1e-15
75. Time: 78.74 kyr b2k, Direction: Downward, d_statistics: 0.6720, p_values: < 1e-26
76. Time: 79.24 kyr b2k, Direction: Upward, d_statistics: 0.5520, p_values: < 1e-17
77. Time: 82.24 kyr b2k, Direction: Upward, d_statistics: 0.5120, p_values: < 1e-14
78. Time: 83.02 kyr b2k, Direction: Downward, d_statistics: 0.2720, p_values: < 1e-3
79. Time: 84.42 kyr b2k, Direction: Downward, d_statistics: 0.8400, p_values: < 1e-44
80. Time: 84.76 kyr b2k, Direction: Upward, d_statistics: 0.9760, p_values: < 1e-67
81. Time: 85.20 kyr b2k, Direction: Upward, d_statistics: 0.8640, p_values: < 1e-47
82. Time: 87.66 kyr b2k, Direction: Downward, d_statistics: 0.8880, p_values: < 1e-51
83. Time: 88.00 kyr b2k, Direction: Downward, d_statistics: 0.8720, p_values: < 1e-48
84. Time: 88.96 kyr b2k, Direction: Downward, d_statistics: 0.5120, p_values: < 1e-14
85. Time: 90.06 kyr b2k, Direction: Upward, d_statistics: 0.5840, p_values: < 1e-19
86. Time: 91.72 kyr b2k, Direction: Downward, d_statistics: 0.2640, p_values: < 1e-3
87. Time: 96.54 kyr b2k, Direction: Upward, d_statistics: 0.4560, p_values: < 1e-11
88. Time: 97.54 kyr b2k, Direction: Upward, d_statistics: 0.4320, p_values: < 1e-10
89. Time: 104.02 kyr b2k, Direction: Upward, d_statistics: 0.6320, p_values: < 1e-23
90. Time: 104.38 kyr b2k, Direction: Downward, d_statistics: 0.4800, p_values: < 1e-12
91. Time: 104.54 kyr b2k, Direction: Upward, d_statistics: 0.4880, p_values: < 1e-13
92. Time: 105.54 kyr b2k, Direction: Downward, d_statistics: 0.4480, p_values: < 1e-10
93. Time: 106.20 kyr b2k, Direction: Upward, d_statistics: 0.2960, p_values: < 1e-4
94. Time: 106.32 kyr b2k, Direction: Downward, d_statistics: 0.3120, p_values: < 1e-5
95. Time: 106.76 kyr b2k, Direction: Upward, d_statistics: 0.3600, p_values: < 1e-6
96. Time: 106.90 kyr b2k, Direction: Downward, d_statistics: 0.4080, p_values: < 1e-8
97. Time: 108.30 kyr b2k, Direction: Upward, d_statistics: 0.9040, p_values: < 1e-53
98. Time: 109.30 kyr b2k, Direction: Upward, d_statistics: 0.5360, p_values: < 1e-16
99. Time: 110.62 kyr b2k, Direction: Downward, d_statistics: 0.9120, p_values: < 1e-54
100. Time: 110.94 kyr b2k, Direction: Upward, d_statistics: 0.8560, p_values: < 1e-46
101. Time: 111.34 kyr b2k, Direction: Downward, d_statistics: 0.8720, p_values: < 1e-48
102. Time: 111.94 kyr b2k, Direction: Downward, d_statistics: 0.9360, p_values: < 1e-59
103. Time: 115.38 kyr b2k, Direction: Upward, d_statistics: 0.7600, p_values: < 1e-34
104. Time: 119.14 kyr b2k, Direction: Downward, d_statistics: 1.0000, p_values: < 1e-73
Method Parameters:
w_min: 0.12
w_max: 2.5
n_w: 15
d_c: 0.77
n_c: 3
s_c: 2
x_c: 0.8
Step 2: Transition Visualization
The NGRIP time series with all detected transitions: - Red lines: upward transitions (warming) - Blue lines: downward transitions (cooling)
import matplotlib.pyplot as plt

fig, ax = transitions.plot(figsize=(15, 8),
                          title='NGRIP Tipping Points Detection — KS Test',
                          upward_color='red',
                          downward_color='blue')
ax.grid(True, alpha=0.3)
plt.tight_layout()
plt.show()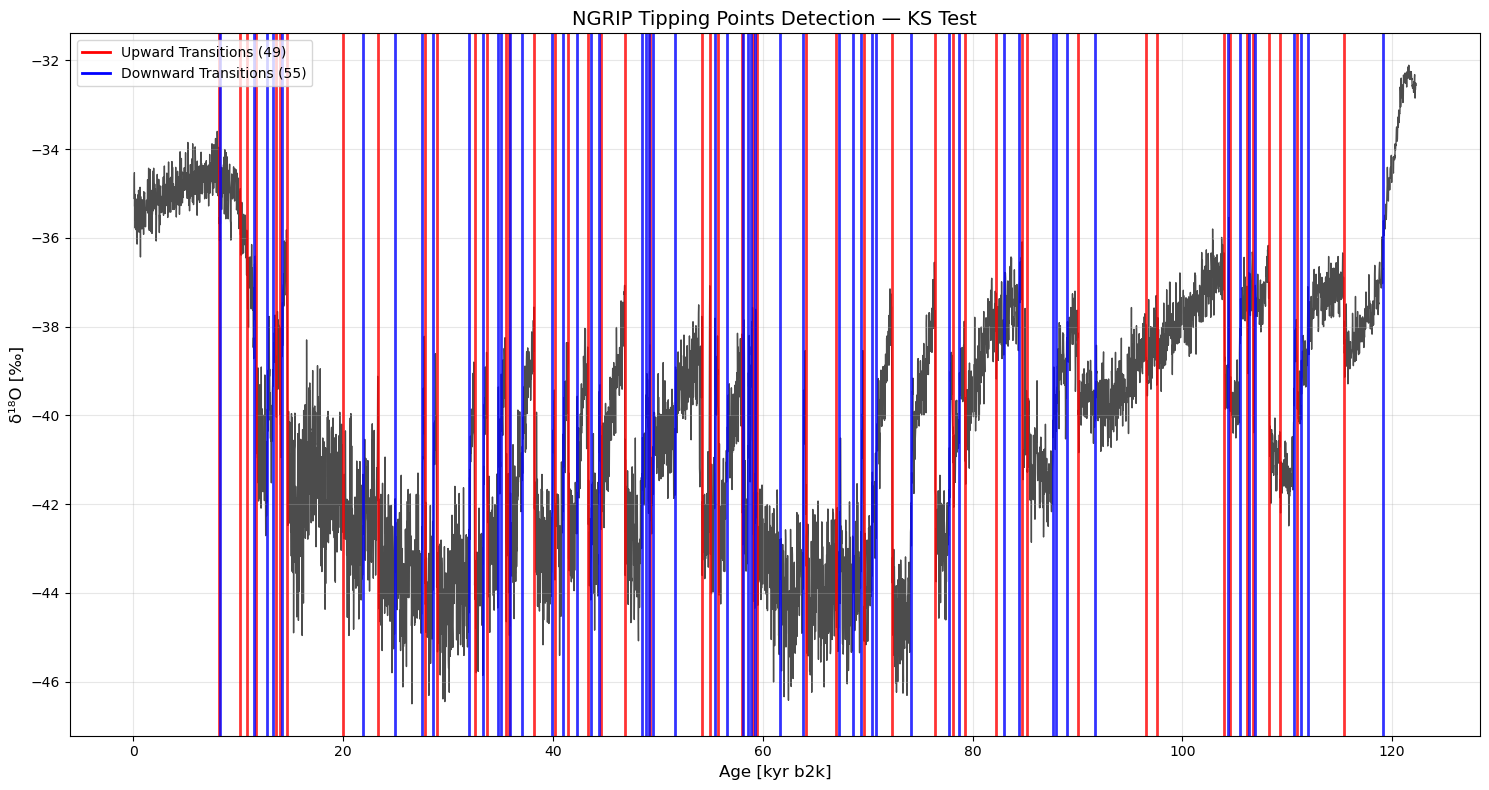
Step 3: Load Known DO Events for Validation
To validate our detection results, we compare against published Dansgaard-Oeschger (DO) events, documented abrupt warming episodes in the NGRIP record.
Reference: Rasmussen et al. (2014)
do_events = pd.read_csv('../ammonyte/data/DO_events.csv', comment='#')
main_do_events = do_events['main_kyr_b2k'].dropna().values
print(f"Main DO events: {len(main_do_events)}")
Main DO events: 25Step 4: Quantitative Validation Against Known DO Events
DO events are abrupt warming transitions, so we compare only detected upward transitions against the 25 main DO onset times, using a \(\pm\) 500-year tolerance window.
# Filter to upward transitions only
upward_mask = transitions.jump_values == 1
detected_upward = transitions.jump_times[upward_mask]
detected_upward = detected_upward[~np.isnan(detected_upward)]

results = amt.utils.evaluate_detection(detected_upward, main_do_events, tolerance=0.5)
print(results)
Detection Evaluation Metrics
============================
Metrics calculated within tolerance = 0.5
Performance Scores:
+-----------+---------+
| Metric | Value |
+===========+=========+
| Precision | 0.3878 |
+-----------+---------+
| Recall | 0.76 |
+-----------+---------+
| F1 Score | 0.5135 |
+-----------+---------+
Detection Counts:
+-----------------+---------+
| Category | Count |
+=================+=========+
| True Positives | 19 |
+-----------------+---------+
| False Positives | 30 |
+-----------------+---------+
| False Negatives | 6 |
+-----------------+---------+
Summary:
Detected: 49 | Ground Truth: 25
Step 5: Validation Visualization
Detected upward transitions vs. known DO events on the NGRIP record: - Red lines: detected upward transitions - Green dashed lines: documented DO warming events (Rasmussen et al., 2014)
fig, ax = plt.subplots(figsize=(15, 8))
ax.plot(ngrip.time, ngrip.value, color='black', linewidth=0.8, label='NGRIP $\delta^{18}\mathrm{O}$')

first_up = True
for t, direction in zip(transitions.jump_times, transitions.jump_values):
    if direction > 0:
        label = 'Detected Upward Transitions' if first_up else None
        ax.axvline(x=t, color='red', alpha=0.7, linewidth=1.5, label=label)
        first_up = False

for i, event_time in enumerate(main_do_events):
    label = f'DO Events — Rasmussen et al. (2014) (n={len(main_do_events)})' if i == 0 else None
    ax.axvline(event_time, color='green', linestyle='--', linewidth=1.5, alpha=0.8, label=label)

ax.set_xlabel('Time (kyr b2k)', fontsize=14)
ax.set_ylabel('$\delta^{18}\mathrm{O}$ (‰)', fontsize=14)
ax.set_title('NGRIP Upward Transitions vs. Main Dansgaard-Oeschger Events', fontsize=14)
ax.legend(loc='upper right')
ax.grid(True, alpha=0.3)
plt.tight_layout()
plt.show()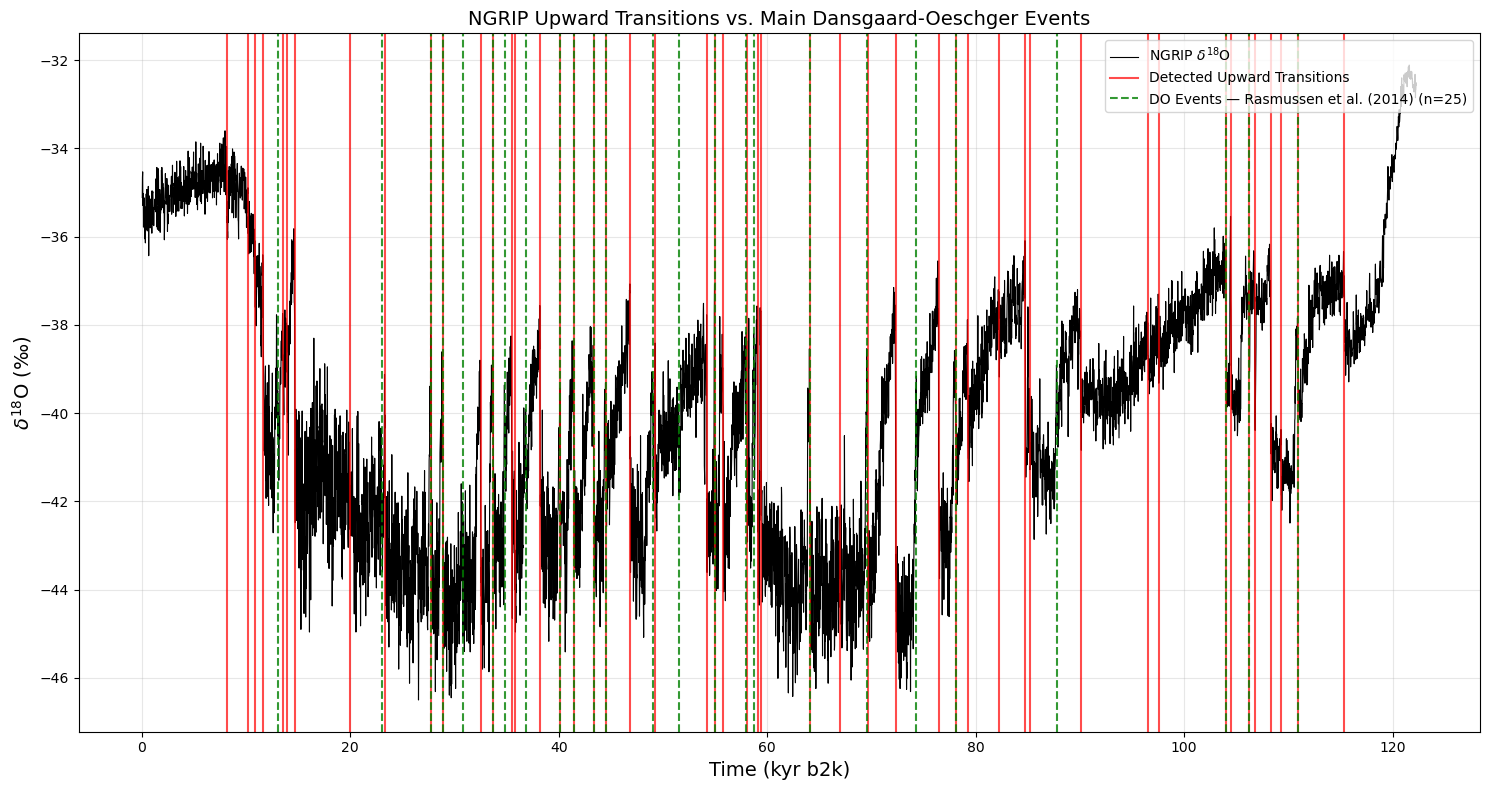
Conclusion
We see that the KS test is able to identify 19 of 25 (76%) of the DO warming events documented by Rasmussen et al. (2014), with a precision of 39% (F1 = 0.51).
Pros: Fast and simple, a single Series.kstest() call scans the entire record in seconds. Each detected transition comes with a D-statistic and p-value, making the statistical evidence easy to inspect and report.
Major drawback: The KS test only tracks excursions in the distribution of values. It says nothing about the dynamics, if the climate shifts state in phase space without a large amplitude change, the KS test will miss it. For dynamically-sensitive detection, see the LERM tutorial.
For the original method, see Bagniewski et al. (2021).