3.1 Data and packages
3.1.2 Data
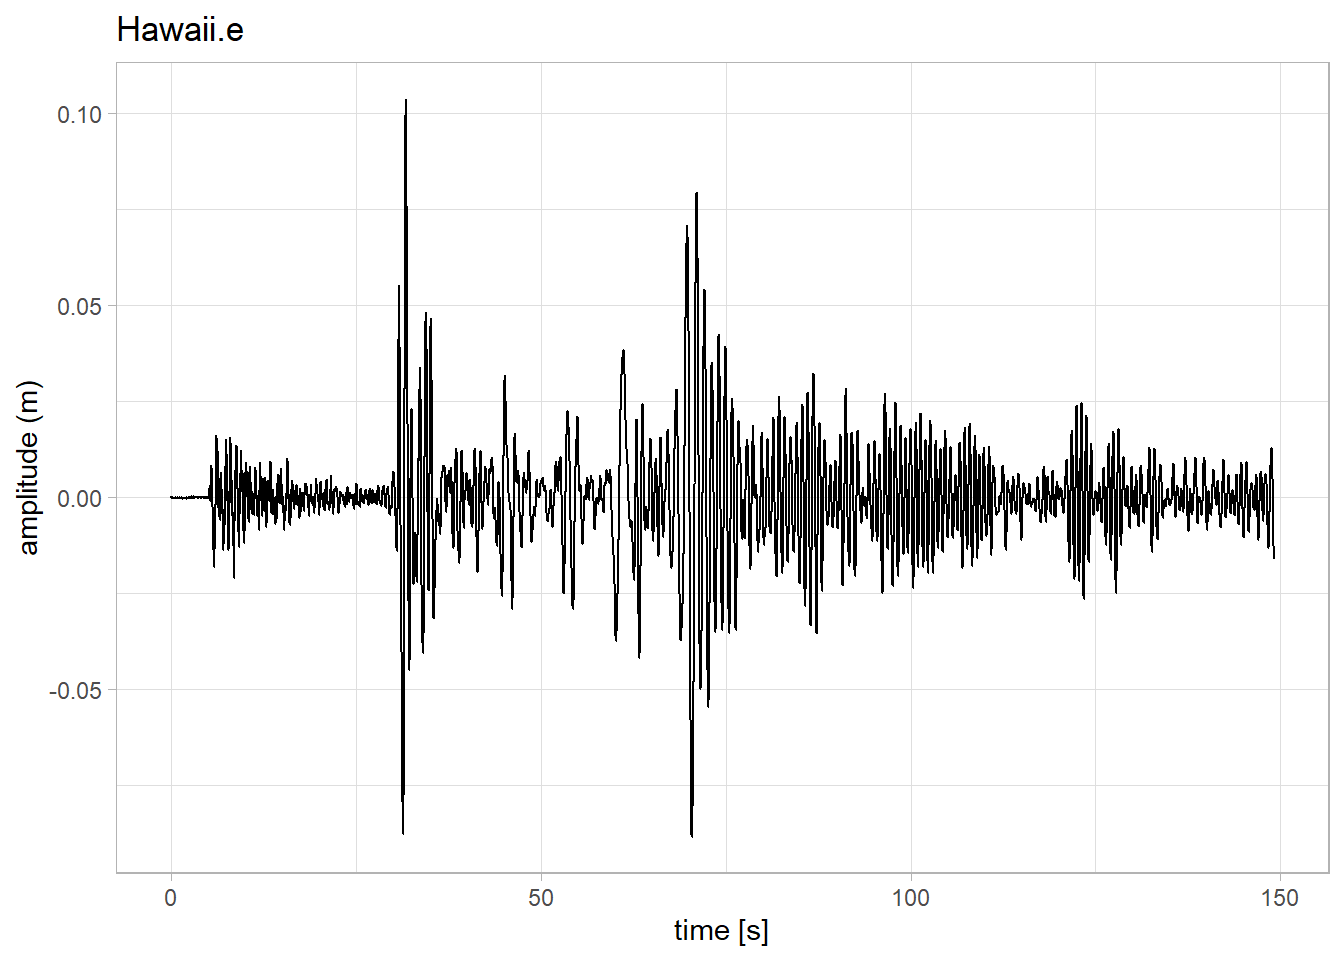
Let’s use data from a Hawai’i seismogram and isolate certain oscillations.
df <- read.table('https://github.com/LinkedEarth/PyRATES_practicums_py/raw/main/jbook/data/hawaii.e.dat', col.names = c('time', 'ground_motion'))
df$time <- df$time / 1000
df$ground_motion <- df$ground_motion * 1000

ggplot(df, aes(x = time, y = ground_motion)) +
  geom_line() +
  labs(x = 'time [s]', y = 'amplitude (m)', title = 'Hawaii.e') +
  theme_light()