4.2 Spurious Correlations
In the geosciences, there are two process that might artificially increase correlations between otherwise unrelated variables
4.2.1 Smoothing
- common trends
- Smoothing-enhanced correlations
dfAll$lowpassNAO <- smooth.spline(x = dfAll$datetime, y=dfAll$NAO, spar = 0.2)$y
dfAll$lowpassSOI <- smooth.spline(x = dfAll$datetime, y=dfAll$SOI, spar = 0.2)$y
Let’s reformat and plot the smoothed series
allLong2 <- melt(dfAll,id.vars = "datetime")
allLong2 <- allLong2 %>%
  mutate(group = ifelse(grepl("SOI", variable), "SOI", "NAO")) %>%
  mutate(type = ifelse(grepl("lowpass", variable), "filtered", "original"))
head(allLong2)
## datetime variable value group type
## 1 1951-01-31 SOI 0.9 SOI original
## 2 1951-03-02 SOI -0.1 SOI original
## 3 1951-04-02 SOI -0.3 SOI original
## 4 1951-05-02 SOI -0.7 SOI original
## 5 1951-06-02 SOI 0.2 SOI original
## 6 1951-07-02 SOI -1.0 SOI originalggplot(allLong2, aes(x=datetime, y=value, group=group, color=type)) +
geom_line() +
facet_wrap(~group, ncol=1) +
labs(title = "NAO vs SOI",
y="Index",
x="Year") +
theme_light()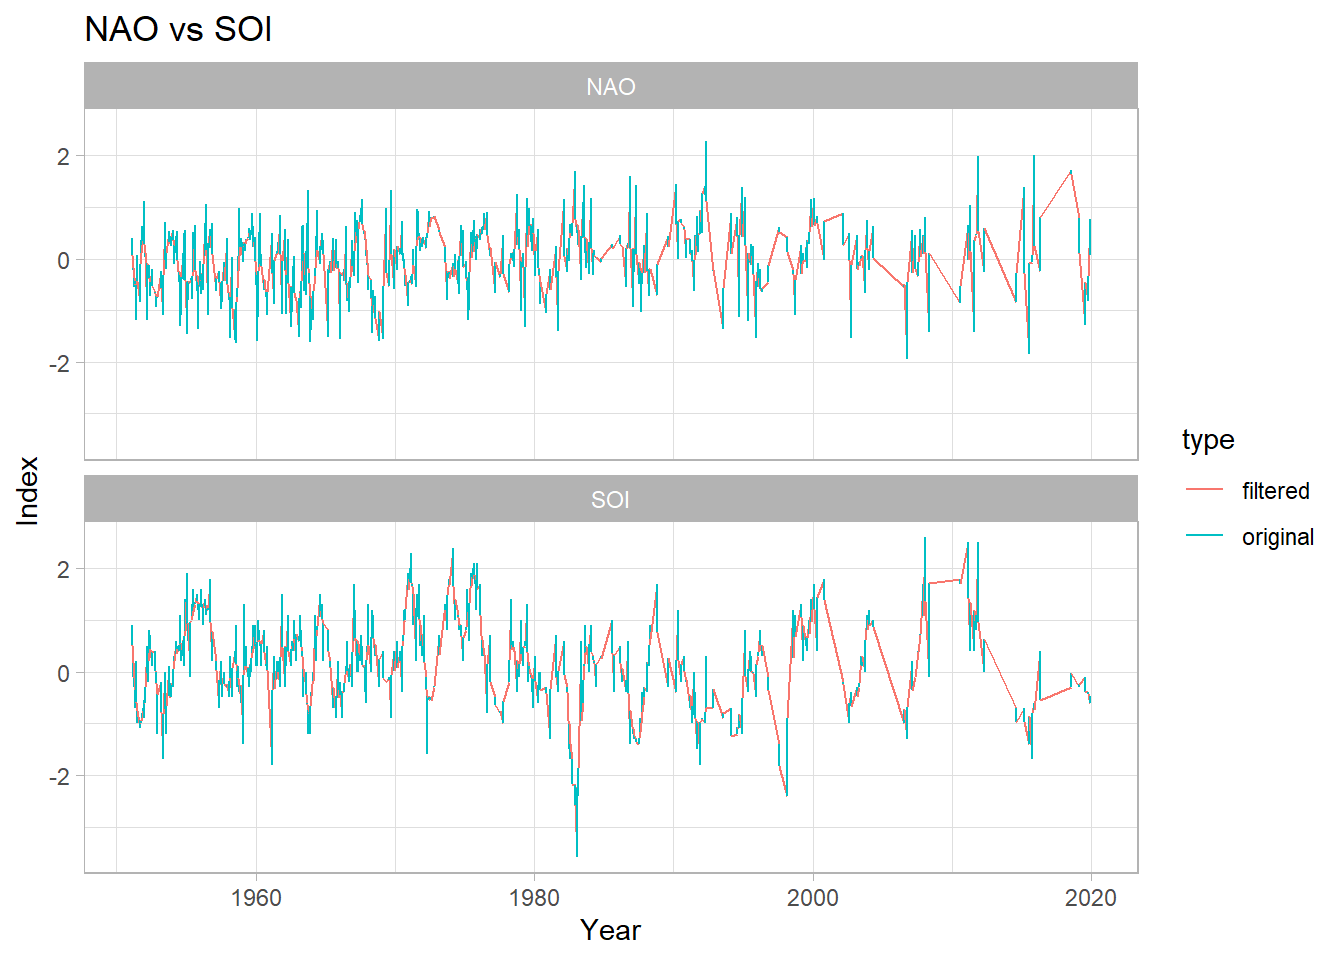
Perhaps the smoothed series will show the cryptic relationship
lapply(c("pearson", "spearman", "kendall"),
       function(x) cor.test(dfAll$lowpassNAO, dfAll$lowpassSOI, method = x))
## [[1]]
##
## Pearson's product-moment correlation
##
## data: dfAll$lowpassNAO and dfAll$lowpassSOI
## t = -2.4976, df = 353, p-value = 0.01296
## alternative hypothesis: true correlation is not equal to 0
## 95 percent confidence interval:
## -0.23267352 -0.02807391
## sample estimates:
## cor
## -0.1317769
##
##
## [[2]]
##
## Spearman's rank correlation rho
##
## data: dfAll$lowpassNAO and dfAll$lowpassSOI
## S = 8059524, p-value = 0.1282
## alternative hypothesis: true rho is not equal to 0
## sample estimates:
## rho
## -0.08088386
##
##
## [[3]]
##
## Kendall's rank correlation tau
##
## data: dfAll$lowpassNAO and dfAll$lowpassSOI
## z = -1.6019, p-value = 0.1092
## alternative hypothesis: true tau is not equal to 0
## sample estimates:
## tau
## -0.0569587lapply(c(1,2,3),
function(x) surrogateCor(dfAll$lowpassNAO,
dfAll$lowpassSOI,
nsim = 10000,
cormethod = x,
genplot = F,
verbose = F)
)## [[1]]
## datcor pvalue
## 1 -0.1317769 0.2708
##
## [[2]]
## datcor pvalue
## 1 -0.08088386 0.4953
##
## [[3]]
## datcor pvalue
## 1 -0.0569587 0.4724Okay, so the simple Pearson correlation comes through significant (p < .05), but this assumes that each value is independent, which we know is not true because we smoothed the series.
The Ebisuzaki test is very useful here, and we see that the corresponding Pearson p-value does not approach .05.
Take-home message: common trends can easily create the appearance of correlations (see Tyler Vigen’s excellent website) and really complicate assessments of significance. If the trend is not relevant to your question, we recommend removing it prior to computing correlations, e.g. using lm().