2.4 Forecasting
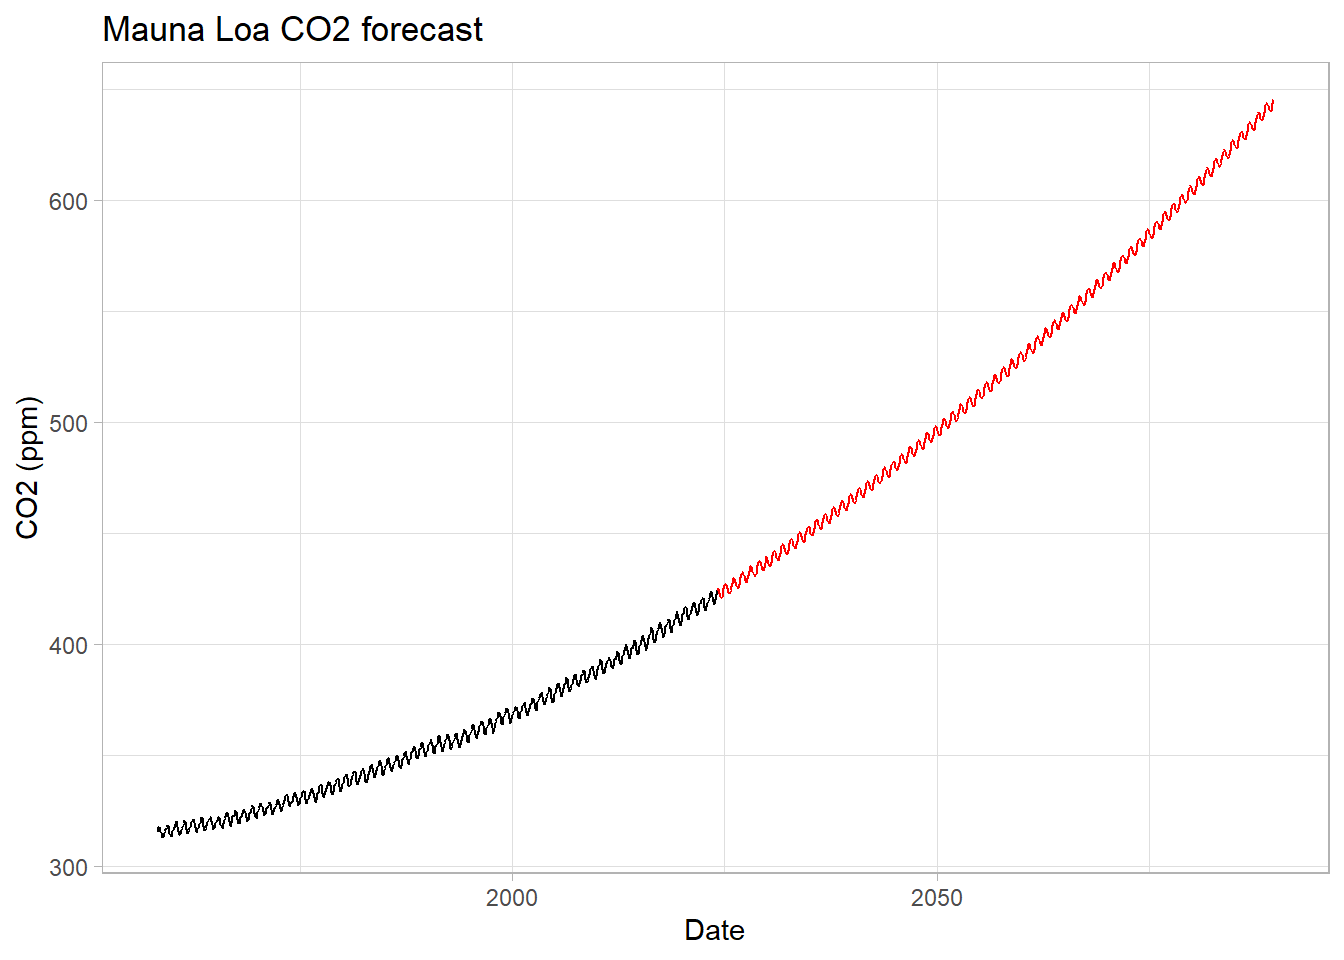
Let us return to our parametric model of atmospheric CO2 (quadractic trend + seasonal harmonics), which we may use to forecast future observations. Let’s extend our time axis to 2050 and see what CO2 may look like then if we don’t curb emissions or fail to remove it from the atmosphere:
Date_ext <- seq(max(df1$Date), length.out=length(df1$Date), by=1/12)

df2 <- df1

df2[,4] <- Date_ext

df2 <- df2 %>%
  mutate(CO2_predicted = predict(fit.lm, newdata = df2)) %>%
  select(Date, CO2_predicted)


ggplot(data=df1, mapping=aes(x=Date, y=CO2)) +
  geom_line() +
  geom_line(data=df2, mapping=aes(x=Date, y=CO2_predicted), inherit.aes = F, color="red") +
  labs(title = "Mauna Loa CO2 forecast",
       y="CO2 (ppm)") +
  theme_light()