import pyleoclim as pyleo
from climatecritters.utils import noiseNoise Generation
Abstract
This notebook covers the two main entry points for generating noise in ClimateCritters: noise.from_series matches AR(1) or spectral properties to a target time series, and noise.from_param generates power-law colored noise, fractional Gaussian noise, or white noise from explicit parameters. Both support ensemble generation with a reproducible random seed.
Keywords
noise, AR(1), colored noise, power-law, fractional Gaussian noise, white noise, ensemble, from_series, from_param, pyleoclim
Creating noise from a target series
The simplest approach to creating noise is to use a pre-defined series you would like emulate. We’ll show how to do this here using the NINO3 index for the past several decades, stored in Pyleoclim.
nino = pyleo.utils.load_dataset('NINO3')
nino.plot()
(<Figure size 1000x400 with 1 Axes>,
<Axes: xlabel='Time [year C.E.]', ylabel='NINO3 [$^{\\circ}$C]'>)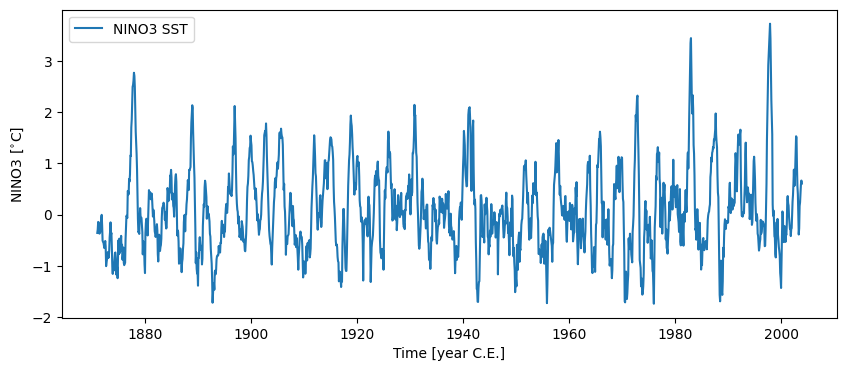
{'archiveType': 'Instrumental', 'label': 'NINO3 SST'}Available methods for this function include:
- ‘ar1sim’ : Simulate an AR(1) process with the same autocorrelation coefficient as the original series
- ‘phaseran’ : Phase randomize the original series and use that as noise
noise_series = noise.from_series(nino, method='ar1sim')
noise_series.plot()
(<Figure size 1000x400 with 1 Axes>,
<Axes: title={'center': 'AR(1) surrogates (MoM)'}, xlabel='Time [year C.E.]', ylabel='NINO3 [$^{\\circ}$C]'>)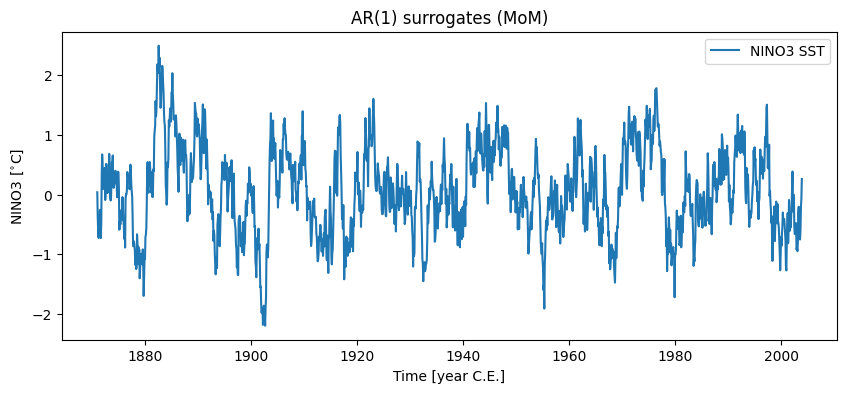
{'archiveType': 'Instrumental', 'label': 'NINO3 SST'}You can also specify the number parameter if you would like multiple noise realizations. This will return an ensemble.
noise_series = noise.from_series(nino, method='ar1sim',number=10)
noise_series.plot_envelope()
(<Figure size 1000x400 with 1 Axes>,
<Axes: xlabel='Time [year C.E.]', ylabel='NINO3 [$^{\\circ}$C]'>)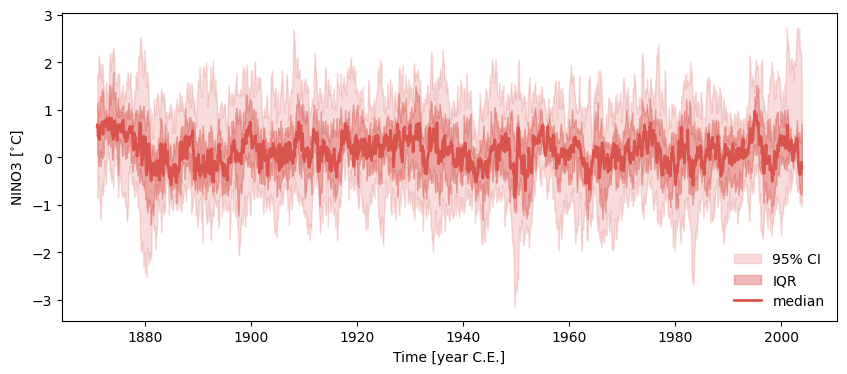
{'archiveType': 'Instrumental', 'label': 'NINO3 SST'}Creating noise from parameter values
The other, somewhat more involved option to creating noise using ClimateCritters is from a set of parameters. Both the choice of time axis and the value axis need to be carefully considered here.
The time axis
Creating the time axis can be done in a two main ways:
- By specifying the length and a type of spacing (using
time_pattern='even'ortime_pattern='random') - By specifying the time axis using a pre-defined array (using
time_pattern='specified')
Using time_pattern='even':
#Specifying the length and type of spacing
ts = noise.from_param(method='ar1sim',length=1000,time_pattern='even',noise_param=[1,1])
ts.plot()
(<Figure size 1000x400 with 1 Axes>,
<Axes: title={'center': 'AR(1) surrogates (MoM)'}, xlabel='Time [years CE]', ylabel='value'>)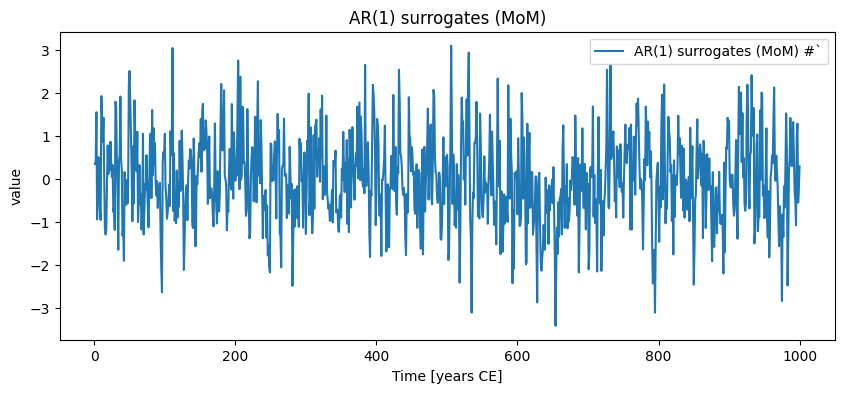
{'archiveType': 'Instrumental', 'label': 'NINO3 SST'}Using time_pattern='random' (note that this re-uses the pyleoclim function random_time_axis, the arguments for which can be passed in settings):
ts = noise.from_param(method='ar1sim',noise_param=[1,1],length=1000,time_pattern='random',settings={'dist_name':'poisson','dist_param':2})
ts.plot()
(<Figure size 1000x400 with 1 Axes>,
<Axes: title={'center': 'AR(1) surrogates (MoM)'}, xlabel='Time [years CE]', ylabel='value'>)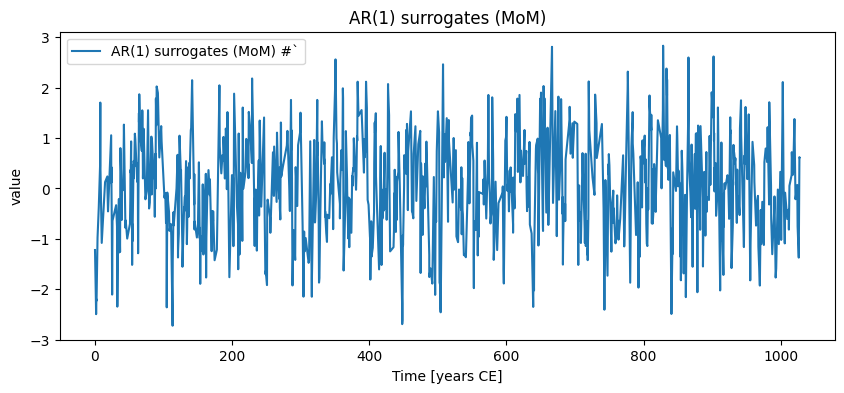
{'archiveType': 'Instrumental', 'label': 'NINO3 SST'}Using time_pattern='specified':
#Specifying the time axis itself
ts = noise.from_param(method='ar1sim',noise_param=[1,1],time_pattern='specified',settings={'time':nino.time})
ts.plot()
(<Figure size 1000x400 with 1 Axes>,
<Axes: title={'center': 'AR(1) surrogates (MoM)'}, xlabel='Time [years CE]', ylabel='value'>)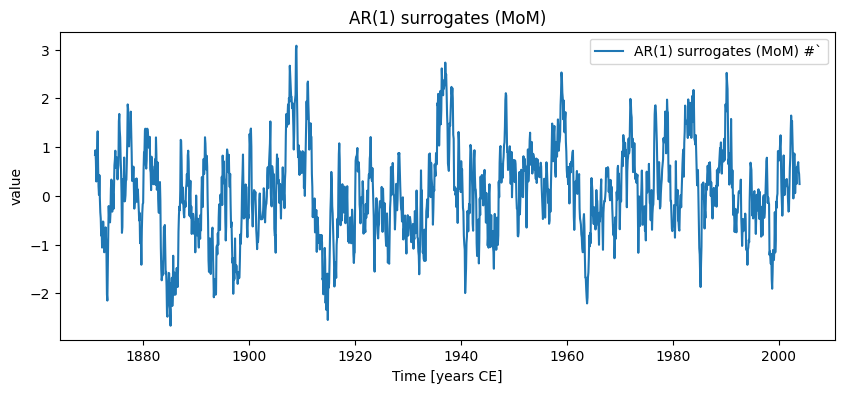
{'archiveType': 'Instrumental', 'label': 'NINO3 SST'}The value axis
There are several methods available to specify the value axis (specified via the method argument):
- ‘ar1sim’ : Simulates an AR(1) process with
noise_param=[tau,sigma] - ‘power_law’ : Simulates noise generated by a power law with
noise_param=[beta] - ‘fGn’ : Simulates fractional gaussian noise with
noise_param=[H] - ‘white’ : Simulates white noise
Each of these methods has it’s own tunable parameter. We’ll illustrate examples of these below.
Method = ‘ar1sim’
ts = noise.from_param(method='ar1sim',noise_param=[1,1],length=1000)
ts.plot()
(<Figure size 1000x400 with 1 Axes>,
<Axes: title={'center': 'AR(1) surrogates (MoM)'}, xlabel='Time [years CE]', ylabel='value'>)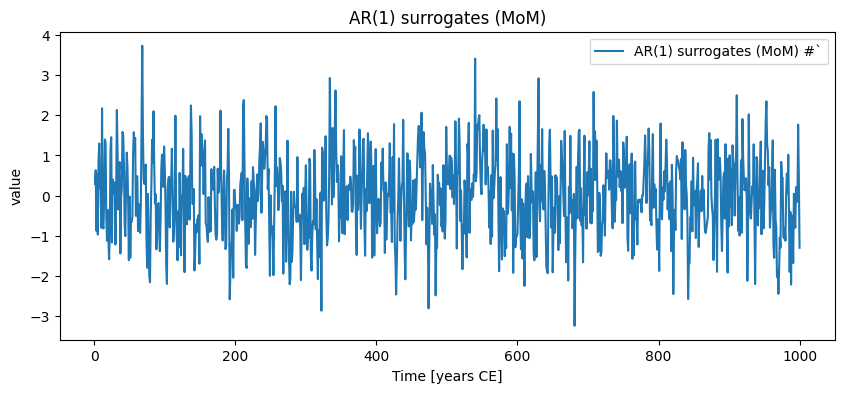
{'archiveType': 'Instrumental', 'label': 'NINO3 SST'}Method = ‘CN’ (colored noise)
ts = noise.from_param(method='CN',noise_param=[1],length=1000)
ts.plot()
(<Figure size 1000x400 with 1 Axes>,
<Axes: title={'center': 'Power-law surrogates ($S(f) \\propto f^{-\\beta}$)'}, xlabel='Time [years CE]', ylabel='value'>)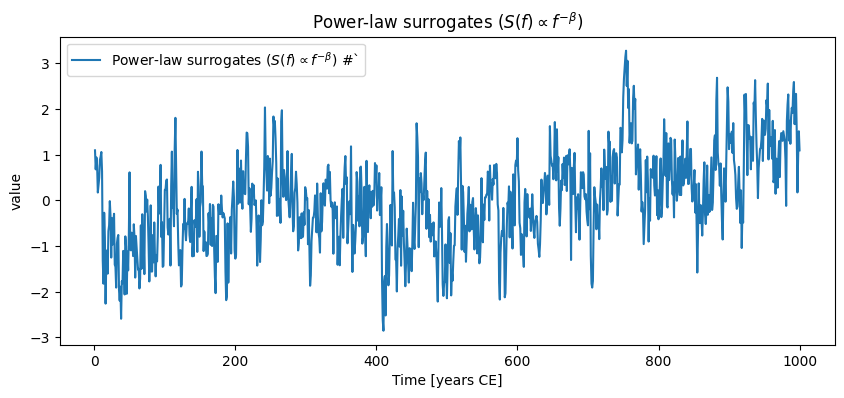
{'archiveType': 'Instrumental', 'label': 'NINO3 SST'}All of these options are available as ensembles via the number argument.
ens = noise.from_param(method='ar1sim',noise_param=[10,5],length=1000,number=10){'archiveType': 'Instrumental', 'label': 'NINO3 SST'}ens.plot_envelope()(<Figure size 1000x400 with 1 Axes>,
<Axes: xlabel='Time [years CE]', ylabel='value'>)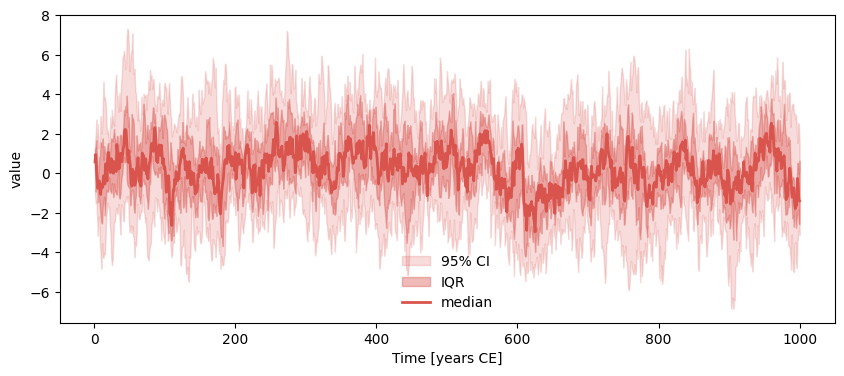
{'archiveType': 'Instrumental', 'label': 'NINO3 SST'}Add from_series example isolating noise from another time series