Roessler
Roessler(
    var_name='roessler',
    a=0.2,
    b=0.2,
    c=5.7,
    state_variables=None,
    diagnostic_variables=None,
    *args,
    **kwargs,
)
Roessler chaotic oscillator.
A three-variable continuous-time system with a single scroll attractor:
dx/dt = -y - z
dy/dt = x + a*y
dz/dt = b + z*(x - c)
Parameters
var_name : str = 'roessler'-
Label for the model output. Default
'roessler'. a : float or callable orcc.Forcing= 0.2-
Controls the strength of the y-feedback. Default 0.2.
b : float or callable orcc.Forcing= 0.2-
Offset in the z equation. Default 0.2.
c : float or callable orcc.Forcing= 5.7-
Nonlinear threshold in the z equation. Default 5.7.
Notes
The canonical chaotic attractor exists near a=b=0.2, c=5.7. State variables are x, y, z in that order. Time-varying parameters are resolved through get_param_value and support callables with signatures (t), (t, state), or (t, state, model).
References
Rössler, O. E. (1976). Phys. Lett. A, 57(5), 397–398.
Examples
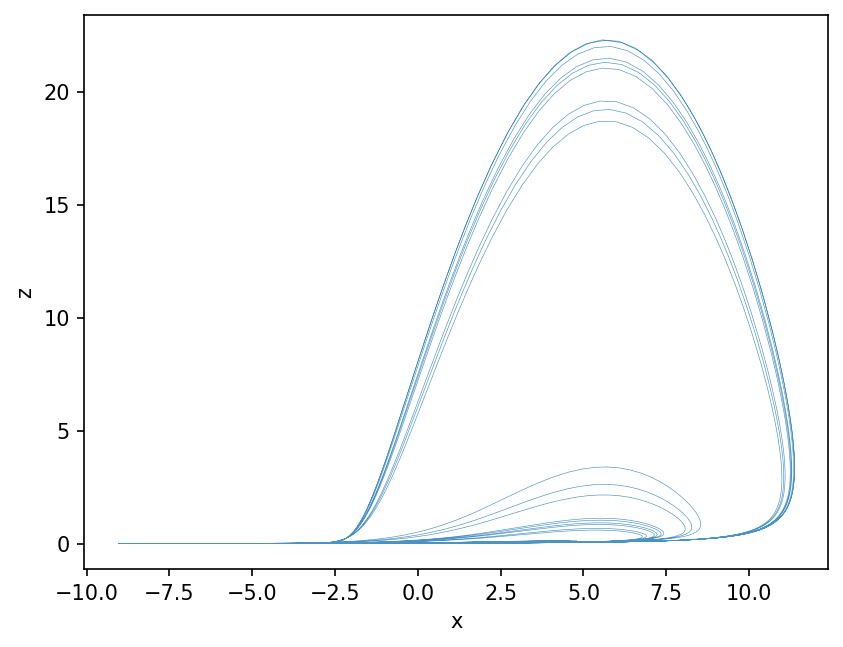
import matplotlib.pyplot as plt
from climatecritters.model_critters.roessler import Roessler

model = Roessler()
output = model.integrate(
    t_span=(0, 200), y0=[0.1, 0.0, 0.0], method='RK45'
)
fig, ax = plt.subplots()
ax.plot(output.state_variables['x'], output.state_variables['z'],
        lw=0.3, alpha=0.8)
ax.set_xlabel('x'); ax.set_ylabel('z')
plt.savefig('docs/reference/figures/Roessler_example.png',
            dpi=150, bbox_inches='tight')