utils.resample.downsample
utils.resample.downsample(
    series,
    method='exponential',
    param=None,
    return_index=False,
    seed=None,
)
Downsample a Pyleoclim series by drawing random time increments.
Simulates irregular sampling by generating random index increments from a chosen probability distribution and selecting the corresponding time points from the original series.
Parameters
series :pyleoclim.Series-
The time series to downsample.
method : str = 'exponential'-
Probability distribution used to draw index increments. One of: -
'exponential'— exponential distribution;paramis a 1-element list[scale](i.e. mean gap size). -'poisson'— Poisson distribution;paramis[rate]. -'pareto'— Pareto distribution;paramis[shape, scale]. -'random_choice'— discrete distribution;paramis[values, probabilities]where both arrays have the same length. Default'exponential'. param : list or None = None-
Parameter(s) for the chosen distribution. Default
[1](exponential with scale 1). return_index : bool = False-
If
True, return the integer index array instead of a new series. DefaultFalse. seed : int or None = None-
Seed for the random number generator. Pass an integer for reproducible results. Default
None.
Returns
downsampled : pyleoclim.Series or list of int-
Downsampled series (
return_index=False) or list of selected indices (return_index=True).
Raises
: ValueError-
If
methodis not recognised, orparamhas the wrong shape for the chosen distribution.
Examples
import matplotlib.pyplot as plt
import pyleoclim as pyleo
from climatecritters.utils.resample import downsample
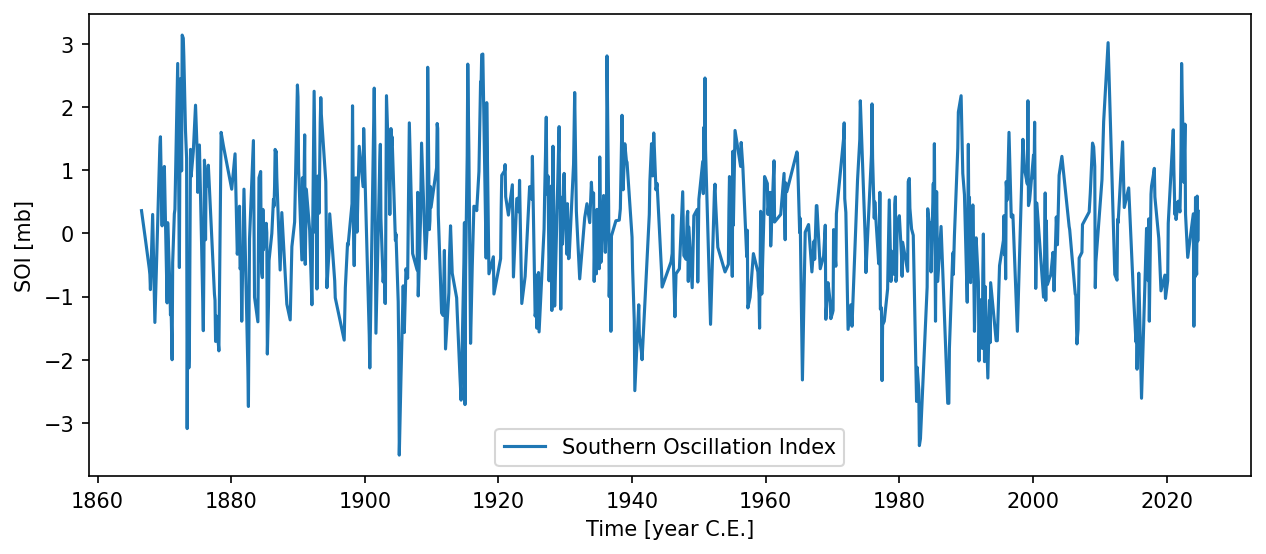
soi = pyleo.utils.load_dataset('SOI')
soi_sparse = downsample(soi, method='exponential', param=[3.0], seed=42)
soi_sparse.plot()
plt.savefig('docs/reference/figures/downsample_example.png',
dpi=150, bbox_inches='tight')