Stommel
Stommel(
    var_name='stommel',
    alpha=1.0,
    beta=1.0,
    k=1.0,
    E=0.0,
    lambda_T=1.0,
    lambda_S=1.0,
    T_star=1.0,
    S_star=0.0,
    state_variables=None,
    diagnostic_variables=None,
    *args,
    **kwargs,
)
Minimal two-box Stommel thermohaline circulation model.
State variables are the pole-to-equator temperature contrast T and salinity contrast S. The overturning strength is parameterized as:
q = k * (alpha*T - beta*S)and the prognostic equations are:
dT/dt = -lambda_T * (T - T_star) - |q|*T
dS/dt =  E - lambda_S * (S - S_star) - |q|*S
Parameters
var_name : str = 'stommel'-
Label for the model output. Default
'stommel'. alpha : float or callable orcc.Forcing= 1.0-
Thermal expansion coefficient. Default 1.0.
beta : float or callable orcc.Forcing= 1.0-
Haline contraction coefficient. Default 1.0.
k : float or callable orcc.Forcing= 1.0-
Hydraulic constant controlling overturning sensitivity. Default 1.0.
E : float or callable orcc.Forcing= 0.0-
Net evaporation-minus-precipitation freshwater flux. Default 0.0.
lambda_T : float or callable orcc.Forcing= 1.0-
Thermal restoring rate. Default 1.0.
lambda_S : float or callable orcc.Forcing= 1.0-
Saline restoring rate. Default 1.0.
T_star : float or callable orcc.Forcing= 1.0-
Equilibrium temperature contrast. Default 1.0.
S_star : float or callable orcc.Forcing= 0.0-
Equilibrium salinity contrast. Default 0.0.
Notes
The model uses uses_post_history to compute the overturning diagnostic q after integration. State variables are T and S; diagnostic variable is q.
References
Stommel, H. (1961). Thermohaline convection with two stable regimes of flow. Tellus, 13(2), 224–230.
Notes
State variables are T and S (in that order). Diagnostic variable is q (overturning strength), computed after integration.
To drive the salinity equation with an external freshwater forcing::
model = Stommel(E=0.0)
model.register_forcing('S', cc.Forcing(lambda t: 0.1),
                       attachment_style='additive', timing='pre')
Examples
import climatecritters as cc
from climatecritters.model_critters.stommel import Stommel
import matplotlib.pyplot as plt
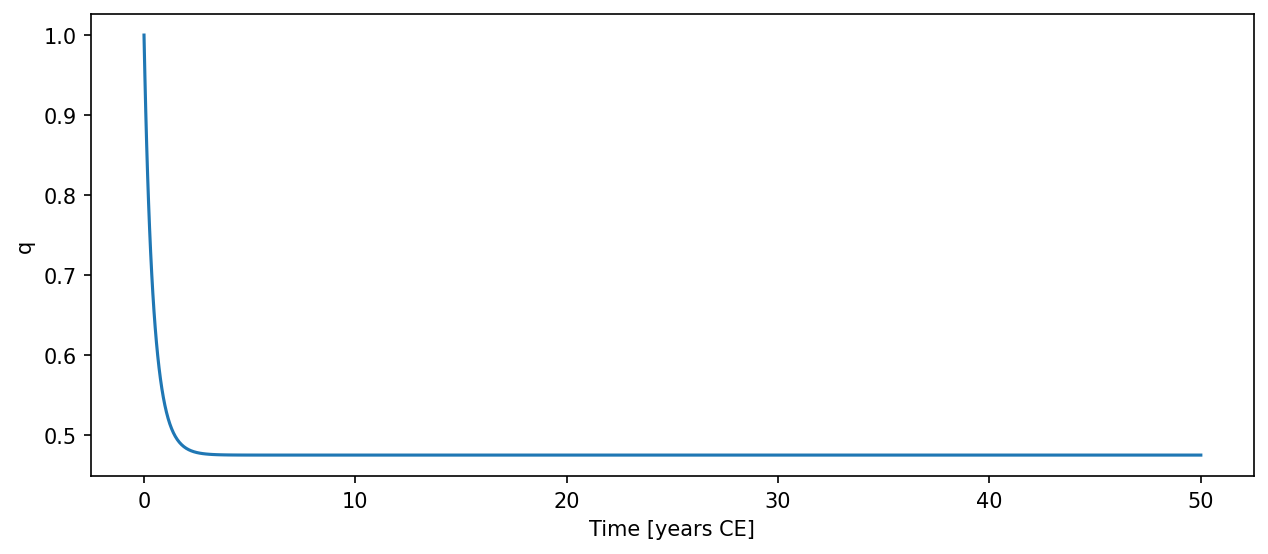
model = Stommel(E=0.3, T_star=1.0, S_star=0.0)
output = model.integrate(
t_span=(0, 50), y0=[1.0, 0.0], method='RK45'
)
ts_q = output.to_pyleo(var_names=['q'])
ts_q.plot()
plt.savefig('docs/reference/figures/Stommel_example.png',
dpi=150, bbox_inches='tight')