utils.func.smooth_and_interpolate
utils.func.smooth_and_interpolate(years, values, target_years=None, window=50)Apply a centered moving-average and interpolate onto a target time axis.
Parameters
years : array -like-
Input time axis.
values : array -like-
Values to smooth and interpolate.
target_years : array -likeor None = None-
Target time axis for interpolation. Defaults to integer annual spacing spanning the input range.
window : int = 50-
Moving-average window length. Values ≤ 1 disable smoothing. Default 50.
Returns
smoothed_interp :ndarray-
Values smoothed and interpolated onto
target_years.
Examples
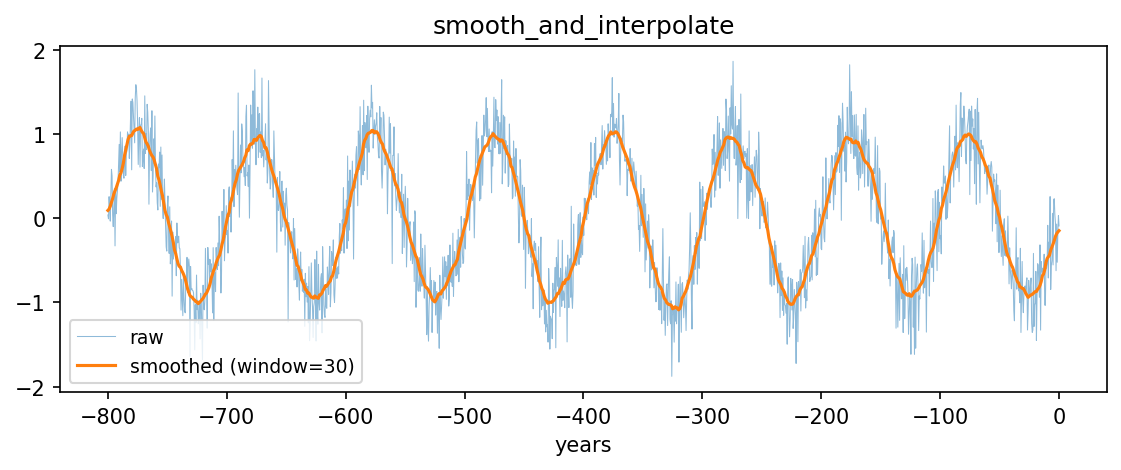
import numpy as np
import matplotlib.pyplot as plt
from climatecritters.utils.func import smooth_and_interpolate

years = np.linspace(-800, 0, 1600)
values = np.sin(2 * np.pi * years / 100) + 0.3 * np.random.default_rng(0).standard_normal(1600)
smoothed = smooth_and_interpolate(years, values, window=30)
target = np.arange(-800, 1, 1.0)
fig, ax = plt.subplots(figsize=(9, 3))
ax.plot(years, values, lw=0.5, alpha=0.5, label='raw')
ax.plot(target, smoothed, lw=1.5, label='smoothed (window=30)')
ax.set_xlabel('years'); ax.legend(fontsize=9)
ax.set_title('smooth_and_interpolate')
plt.savefig('docs/reference/figures/smooth_and_interpolate_example.png',
            dpi=150, bbox_inches='tight')