core.forcing.ForcingSequence
core.forcing.ForcingSequence(parts=None, label='forcing')Composable sequence of ForcingElement parts.
ForcingSequence is a builder — it assembles an ordered timeline of segments and knows how to resolve them. It is not callable and cannot be used directly as a model input. Call compile to produce a Forcing that is callable and ready to register::
seq = Hold(100, value=0.0) + Ramp(50, y0=0.0, yf=4.0) + Hold(100, value=0.0)
f   = seq.compile()
model.register_forcing('S', f, attachment_style='additive', timing='pre')
Parameters
Notes
Operator +
ForcingSequence + ForcingElement→ForcingSequence(append element)ForcingSequence + ForcingSequence→ForcingSequence(concatenate)ForcingSequence + Forcing→Forcing(additive overlay for the full duration of the sequence; auto-compiles)Forcing + ForcingSequence→Forcing(same;__radd__makes this commutative)
No memoization — compile always produces a fresh Forcing. Recompile freely after modifying parts.
Visualisation — call plot to inspect the scenario before registering it. Each segment is colour-coded by type and labelled from its plot_kwargs if provided.
Examples
import matplotlib.pyplot as plt
import climatecritters as cc

scenario = (
    cc.forcing.Hold(200, value=280.0)
    + cc.forcing.Ramp(100, y0=280.0, yf=560.0, shape='cosine')
    + cc.forcing.Hold(200, value=560.0)
)
fig, ax = scenario.plot()
plt.savefig('docs/reference/figures/ForcingSequence_example.png',
            dpi=150, bbox_inches='tight')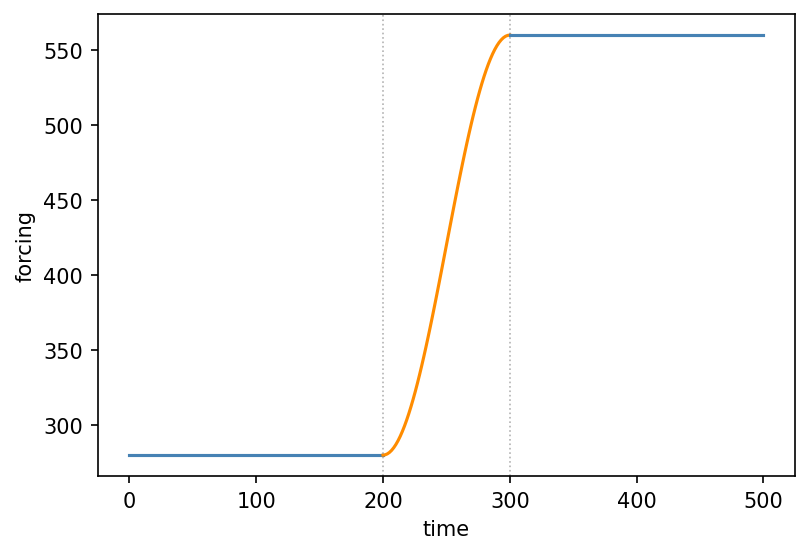
Methods
| Name | Description |
|---|---|
| compile | Resolve all elements and return a callable Forcing. |
| plot | Plot the sequence, colour-coded by segment type. |
compile
core.forcing.ForcingSequence.compile()Resolve all elements and return a callable Forcing.
Each call produces a fresh Forcing with no internal caching. The sequence itself is unchanged and can be extended and recompiled freely::
seq = Hold(50, value=0.0) + Ramp(100, y0=0.0, yf=4.0)
f1  = seq.compile()
seq = seq + Hold(50, value=4.0)
f2  = seq.compile()   # f1 is unaffected
Returns
Raises
: ValueError-
If the sequence has no parts.
: TypeError-
If any part is not a
ForcingElement.
plot
core.forcing.ForcingSequence.plot(t_span=None, n=300, ax=None, **kwargs)Plot the sequence, colour-coded by segment type.
Each segment is drawn separately using its own plot_kwargs if set, otherwise a default colour is chosen by segment kind (Hold → blue, Ramp → orange, Harmonic → green, callable → red). Vertical dotted lines mark the transitions between segments.
Parameters
t_span : (float, float) = None-
Time range to plot. Defaults to
(0, t_end)of the compiled sequence. n : int = 300-
Total number of evaluation points distributed proportionally across segments. Default 300.
ax :matplotlib.axes.Axes= None-
Axes to plot into. A new figure is created if
None. ****kwargs** : = {}-
Additional keyword arguments applied to all segments, overriding per-element
plot_kwargs. Useful for e.g.linewidthoralpha.
Returns
fig :matplotlib.figure.Figureax :matplotlib.axes.Axes
Examples
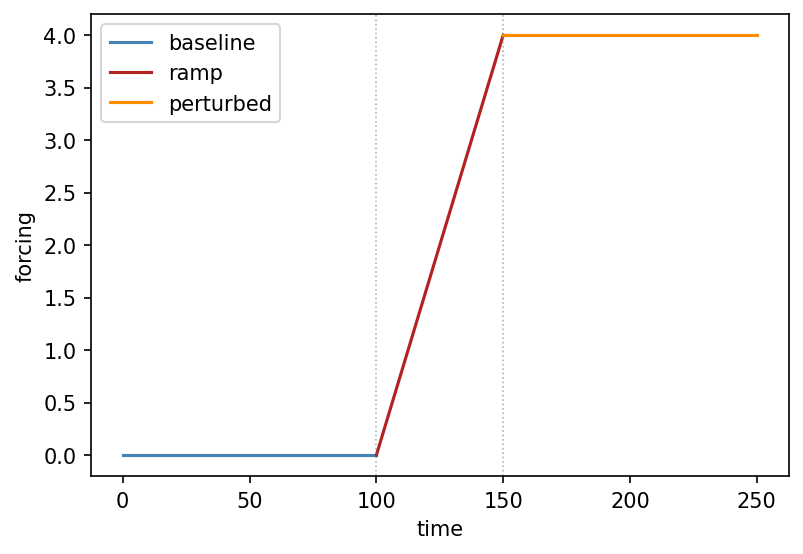
import matplotlib.pyplot as plt
import climatecritters as cc

scenario = (
    cc.forcing.Hold(100, value=0.0, plot_kwargs={'color': 'steelblue', 'label': 'baseline'})
    + cc.forcing.Ramp(50, y0=0.0, yf=4.0, plot_kwargs={'color': 'firebrick', 'label': 'ramp'})
    + cc.forcing.Hold(100, value=4.0, plot_kwargs={'color': 'darkorange', 'label': 'perturbed'})
)
fig, ax = scenario.plot()
ax.set_xlabel('time'); ax.set_ylabel('forcing'); ax.legend()
plt.savefig('docs/reference/figures/ForcingSequence_plot_example.png',
            dpi=150, bbox_inches='tight')