core.forcing.ForcingElement
core.forcing.ForcingElement(func=None, duration=None, plot_kwargs=None)A bounded forcing segment backed by an arbitrary callable.
ForcingElement serves two roles:
Base class for the named segment types
Hold,Ramp, andHarmonic. Those subclasses callsuper().__init__to inheritplot_kwargs.Concrete class for the general case — wrap any callable as a bounded segment with a fixed duration
elem = ForcingElement(lambda t: np.sin(t), duration=10.0)
Parameters
func : callable = None-
Function
f(t) -> float \| ndarray. Receives the absolute time value (t0 + tau) at each evaluation point. duration : float = None-
Length of the segment in model time units. Must be > 0.
plot_kwargs : dict = None-
Matplotlib keyword arguments used when this element is drawn by
.plot()orForcingSequence.plot. Common keys:color,linewidth,linestyle,label,alpha. IfNone(default), a colour is chosen automatically by segment kind.
Notes
A ForcingElement is not callable and cannot be used directly as a model input. Compose it into a ForcingSequence and call ForcingSequence.compile
seq = Hold(5, value=0.0) + elem + Hold(5, value=0.0)
f   = seq.compile()   # → Forcing, ready to register
Operator +
The behaviour of + depends on the type of the right-hand operand:
ForcingElement + ForcingElement→ForcingSequence(temporal concatenation)ForcingElement + ForcingSequence→ForcingSequence(prepend to sequence)ForcingElement + Forcing→Forcing(additive overlay for the duration of the element; auto-compiles)Forcing + ForcingElement→Forcing(same;__radd__makes this commutative)
Examples
import numpy as np
import matplotlib.pyplot as plt
import climatecritters as cc

elem = cc.forcing.ForcingElement(lambda t: np.exp(-0.01 * t), duration=50.0)
fig, ax = elem.plot()
plt.savefig('docs/reference/figures/ForcingElement_example.png',
            dpi=150, bbox_inches='tight')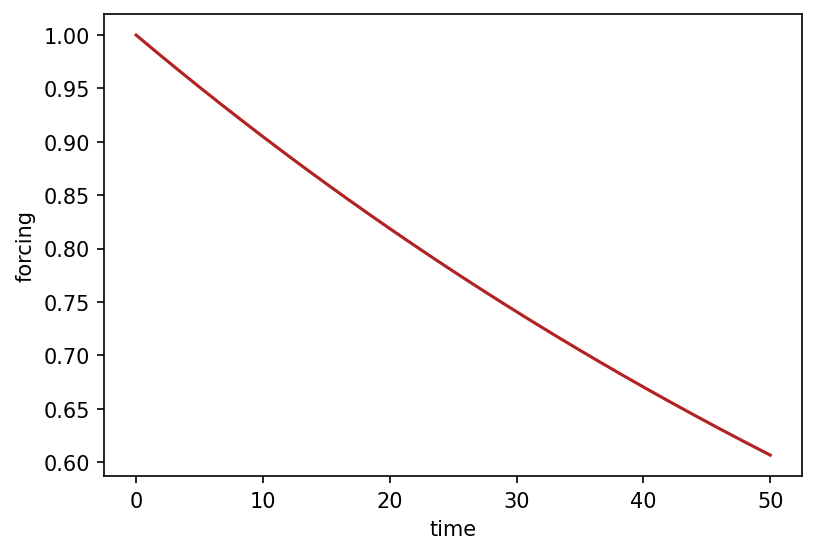
Methods
| Name | Description |
|---|---|
| plot | Plot this element over its duration. |
plot
core.forcing.ForcingElement.plot(t_span=None, n=300, ax=None, **kwargs)Plot this element over its duration.
Delegates to ForcingSequence.plot with this element as the only part. t_span defaults to (0, duration).
Parameters
t_span : (float, float) = None-
Time range to plot. Defaults to
(0, duration). n : int = 300-
Number of evaluation points. Default 300.
ax :matplotlib.axes.Axes= None-
Axes to plot into. A new figure is created if
None. ****kwargs** : = {}-
Additional keyword arguments passed to
ax.plot, overriding anyplot_kwargsset on this element.
Returns
: fig, ax : matplotlib Figure and Axes